
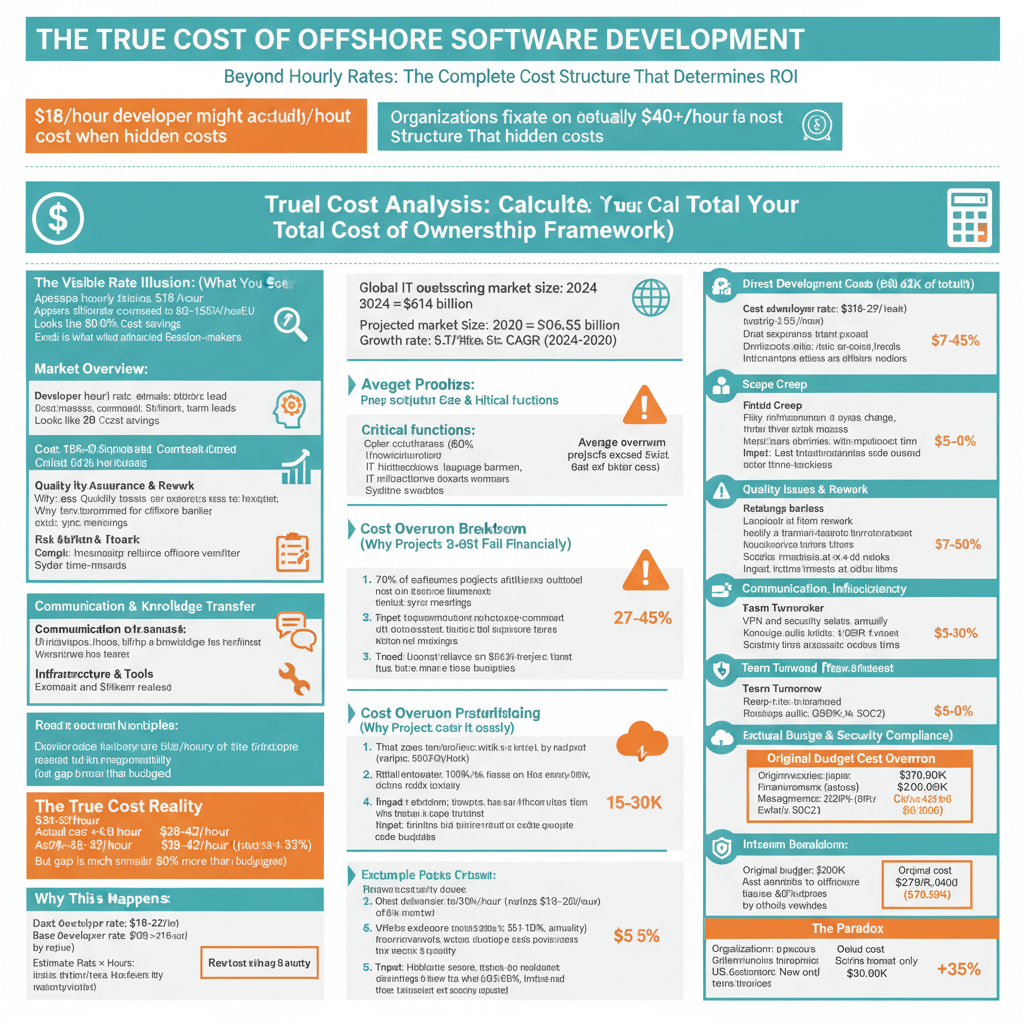
The decision to outsource software development is fundamentally a financial one. Yet most organizations approach it backward, they fixate on hourly rates and miss the total cost structure that determines project success or failure. A developer advertised at $18/hour in Southeast Asia might ultimately cost you $40+ per hour when accounting for management overhead, quality assurance, rework, and communication inefficiencies.
According to Deloitte’s 2024 Global Outsourcing Survey, over 70% of organizations now outsource critical technology functions including cybersecurity, IT infrastructure, and application development, with the global IT outsourcing market projected to reach $806.55 billion by 2030 (growing at 6.51% CAGR).
However, research shows that 70% of software projects exceed initial budgets by an average of 27-45%, with companies often underestimating total costs by 20-30% when planning offshore initiatives. These budget overruns and project delays undermine the cost advantage that motivated the offshore decision in the first place.
This comprehensive guide decodes the true cost structure of offshore software development projects in 2026. We’ll examine each cost factor systematically—from base developer rates to hidden operational expenses—and provide frameworks for accurate budget planning. Our analysis is grounded in current market data, transparent pricing models, and industry best practices from leading offshore vendors.
By the end of this guide, you’ll understand why transparent pricing builds trust, how regional cost advantages compound over time, and most importantly, how to calculate Total Cost of Ownership (TCO) to make informed offshore development decisions.
The Real Cost of Offshore Development: Why Hourly Rates Lie
The headline cost of offshore development is deceptively simple: hire developers at $25/hour instead of $150/hour and save 83%. In reality, total cost of ownership (TCO) adds 25-150% to base rates across hidden operational factors.
Consider this real-world comparison: A UK company can hire four senior developers in-house for approximately £360,000 annually (including taxes, benefits, and overhead). The same team sourced from Poland costs roughly £220,000, while a comparable team from Southeast Asia carries a lower invoice cost. However, the Poland option often delivers lower TCO than the lowest-priced option due to communication efficiency, code quality, and rework reduction.
Industry analysis reveals that companies achieve average savings of 52% on development costs—but only when hidden expenses are accounted for properly. Without this accounting, reported savings evaporate during project execution.
The cost gap between hourly rate and true cost emerges from six primary categories:
- Direct labor variance (skill level, technology specialization)
- Operational overhead (infrastructure, tools, licenses)
- Quality assurance requirements (testing, rework, defect management)
- Compliance and security infrastructure (certifications, audits)
- Management and communication costs (coordination, time zone impact)
- Contingency for scope changes (requirement evolution, change requests)
Factor 1: Direct Developer Costs and Regional Rate Variations
The foundation of offshore development budgeting begins with understanding hourly rates by region, expertise level, and technology specialization. However, these rates represent only the starting point.
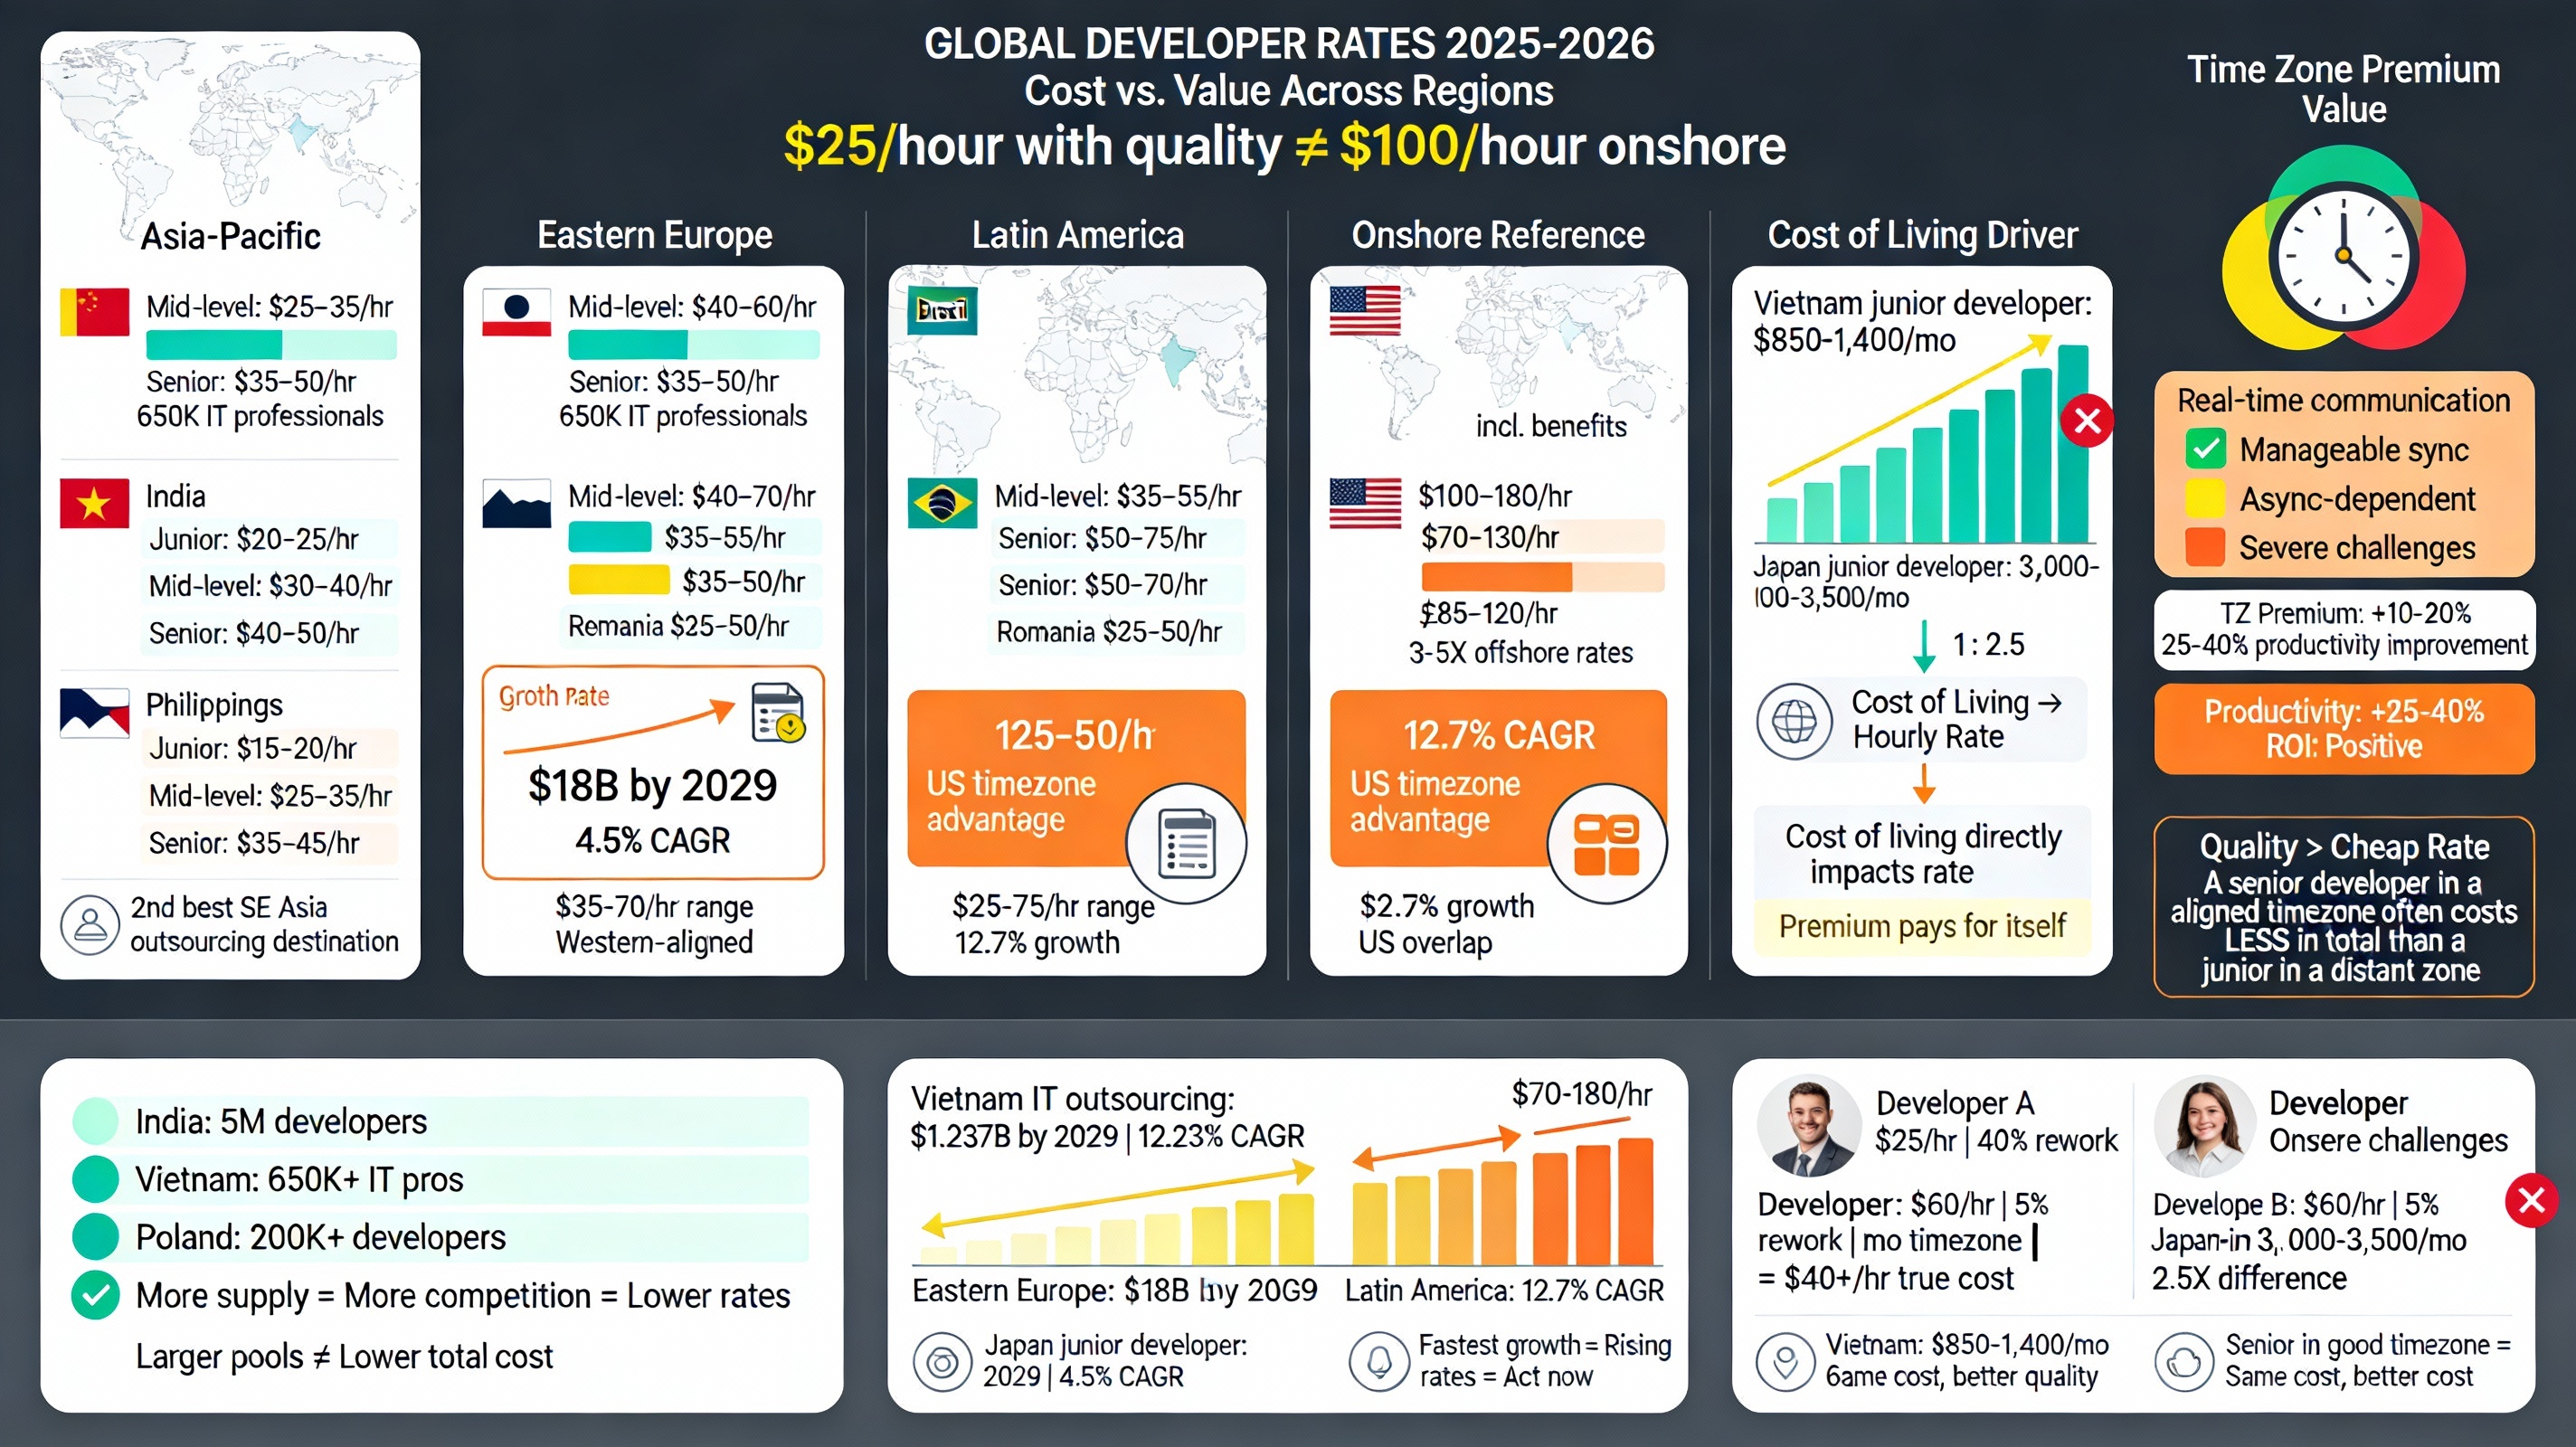
Global Pricing Benchmarks (2025-2026)
Asia-Pacific Rates:
Vietnam: $25–35/hour (mid-level), $35–50/hour (senior)
India: $20–25/hour (junior), $30–40/hour (mid-level), $40–50/hour (senior)
Philippines: $15–20/hour (junior), $25–35/hour (mid-level), $35–45/hour (senior)
Vietnam’s positioning within Asia-Pacific deserves particular emphasis. While rates are comparable to India, Vietnam offers superior value due to several operational advantages:
- Talent pool: Over 650,000 IT professionals (up from 530,000 in 2021)
- Graduate output: 57,000 tech graduates annually in software engineering
- Global ranking: 2nd position among best software outsourcing destinations in Southeast Asia
- Market growth: Vietnam’s IT outsourcing projected to reach $1.237 billion by 2029 (12.23% CAGR)
Eastern Europe Rates (Premium Nearshore):
Poland: $40–60/hour (mid-level), $55–70/hour (senior)
Ukraine: $35–55/hour depending on experience
Romania: $35–50/hour
The Eastern European offshore development market is projected to reach nearly $18 billion by 2029, growing at a 4.5% CAGR.
Latin America Rates:
Brazil: $35–55/hour (mid-level), $50–75/hour (senior)
Colombia: $25–50/hour
Argentina: $25–50/hour
Latin America shows the fastest growth with a projected 12.7% CAGR from 2025 to 2030, offering nearshore advantages for US businesses.
Onshore Reference Rates (2025-2026):
United States: $100–180/hour (including benefits and overhead)
Western Europe: $70–130/hour
United Kingdom: £85–120/hour
Key Insight: Cost vs. Value
The lowest advertised rates don’t correlate with lowest total cost. A senior developer in Poland at $60/hour with 95% first-time code quality and real-time communication often costs substantially less than a $25/hour junior developer in a distant time zone requiring 40% rework.
Factors Driving Regional Rate Variance
Cost of Living Index: Developers in Vietnam earn approximately $850-1,400/month (junior level), compared to $3,000-3,500/month in Japan for junior/mid-level developers. This cost-of-living differential translates directly to service pricing while reflecting professional capability levels.
Talent Supply and Specialization: India’s massive developer pool exceeds 5 million professionals, creating intense competition and varied rate structures. Vietnam, with its growing pool of 650,000+ IT professionals, maintains competitive rates while offering superior talent density in specific technologies like Node.js, React, and cloud-native development.
Economic Stability and Currency Dynamics: Eastern European rates remain stable despite currency fluctuations. Southeast Asian rates can fluctuate 5-15% annually based on exchange rate movements and inflation.
Time Zone Alignment Premium: A developer in a time zone offering real-time overlap with your team justifies a 10-20% rate premium. This premium typically delivers 25-40% productivity improvement, making it cost-effective.
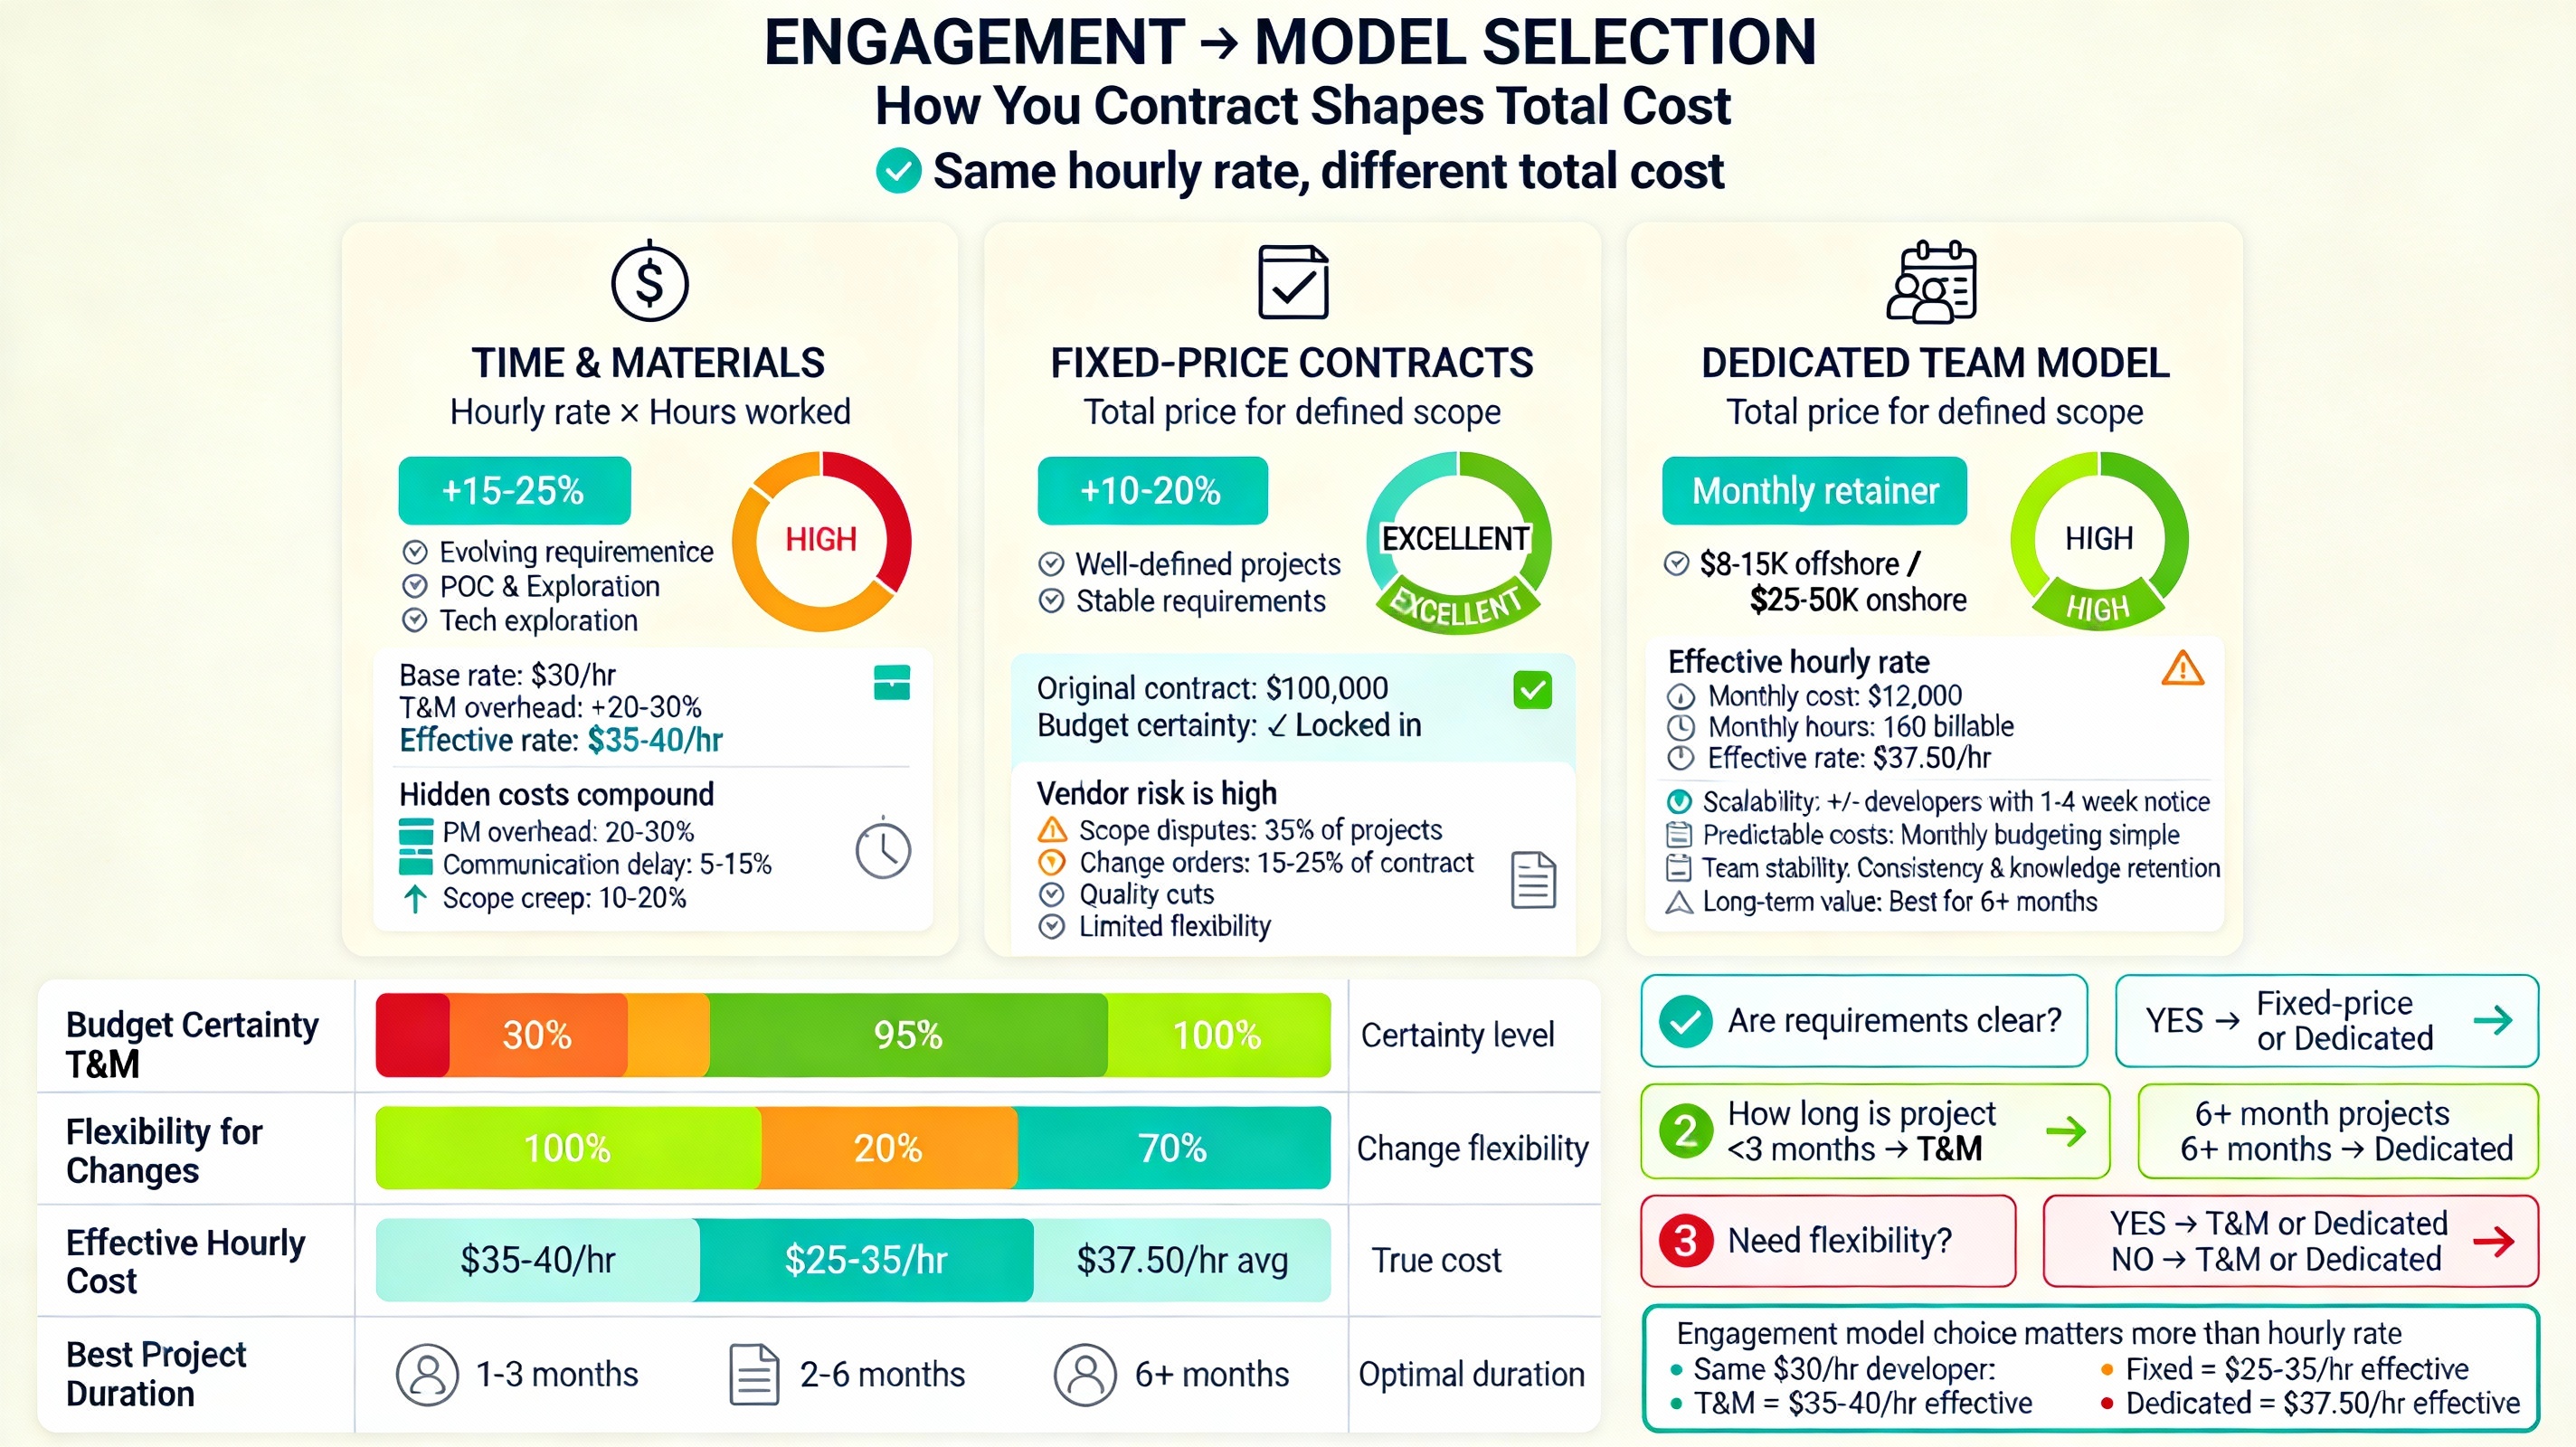
Factor 2: Engagement Model Selection – The Structural Cost Driver
How you contract for offshore development fundamentally shapes total costs. Three primary engagement models dominate the market, each with distinct cost structures and risk profiles.
Time & Materials (T&M) Model
Structure: Hourly rate × hours worked, with time tracking and transparent billing.
Rate Premium: 15–25% higher hourly rates compared to fixed-price contracts due to flexibility and revenue risk to vendors.
Cost Variability: High—budget flexibility but cost uncertainty.
Best For: Projects with evolving requirements, proof-of-concept development, technology exploration.
Hidden Costs:
-
Project management overhead typically adds 20-30% to base costs
-
Communication inefficiency in distant time zones compounds delays
-
Scope creep occurs at higher rates, amplifying budget impact
Real Cost Example: A $30/hour developer under T&M engagement often costs $35-40/hour effective rate when factoring model premiums.
Fixed-Price Contracts
Structure: Predetermined total price for defined scope delivered by specified date.
Rate Premium: 10-20% included in bid to cover vendor risk.
Cost Predictability: Excellent for budget certainty.
Best For: Well-defined projects, stable requirements, clear specifications available before engagement.
Hidden Costs:
-
Scope ambiguity leads to disputes and change orders
-
Vendors may minimize quality to preserve margin
-
Limited flexibility for reasonable requirement refinements
Risk Reality: Research indicates approximately 35% of fixed-price offshore projects experience scope disputes, with average change order costs reaching 15-25% of original contract value.
Dedicated Team Model
Structure: Monthly retainer ($8,000–$15,000 for small offshore teams; $25,000–$50,000 for onshore equivalent).
Cost Structure: Predictable monthly expenses with team composition flexibility.
Scalability: High—easily add or remove developers with 1-4 week notice.
Best For: Long-term projects exceeding 6 months, continuous development, scaling needs, projects requiring team stability.
Effective Hourly Rate: A 4-person dedicated team at $12,000/month operates at approximately $37.50/hour assuming 160 billable hours monthly.
For detailed comparison of these models, review engagement model best practices.
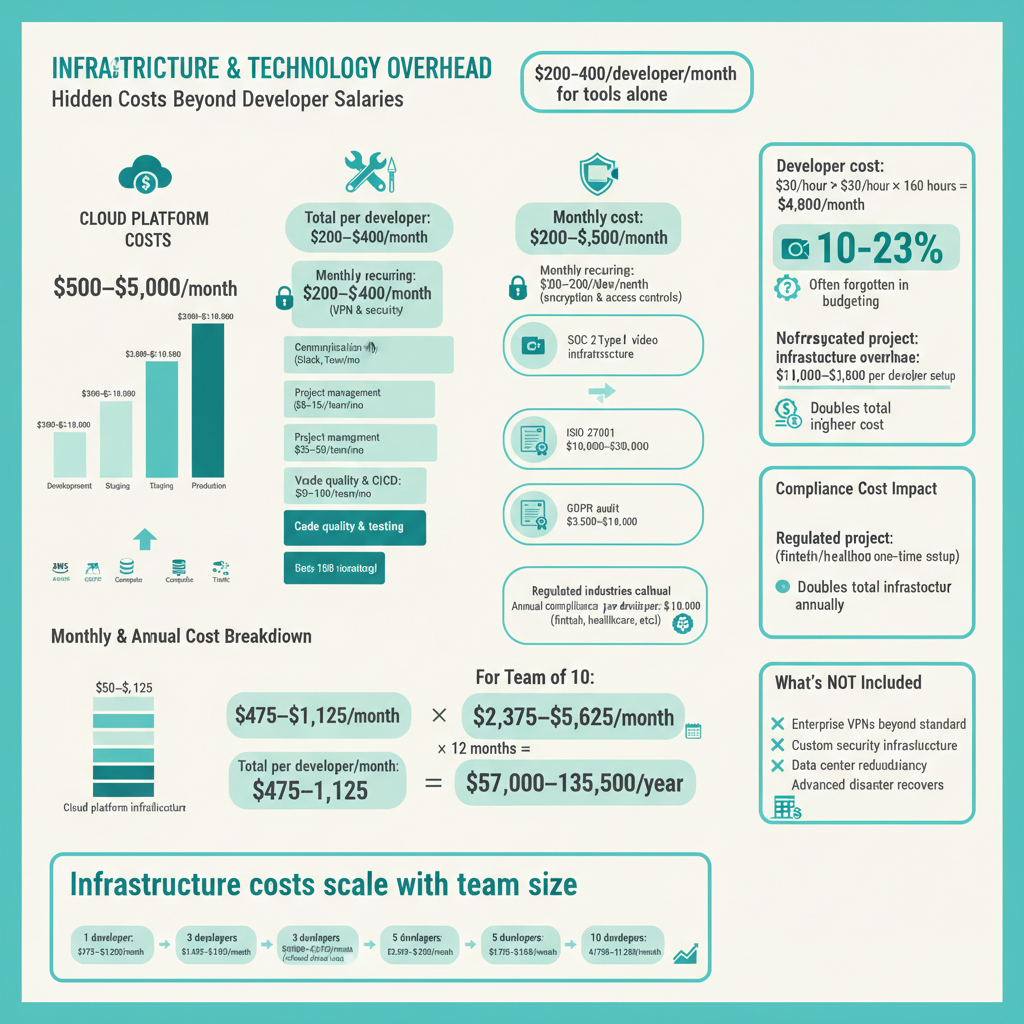
Factor 3: Infrastructure, Tools, and Technology Overhead
Beyond developer salaries, offshore development requires substantial infrastructure investment that many organizations underestimate.
Cloud Platform Costs
AWS, Azure, or Google Cloud: $500–$5,000 per month depending on computational requirements, storage, and traffic volumes.
For typical SaaS applications:
-
Development environment: $500–$1,000/month
-
Staging environment: $300–$500/month
-
Production infrastructure: $2,000–$10,000/month (scales with traffic)
Development Tools and Licenses
Standard tooling per developer includes:
-
IDE and coding tools: $10–20/developer/month
-
Version control and CI/CD: $50–100/month team-wide
-
Project management software: $25–50/month team-wide (see Asana vs Jira comparison for leading options)
-
Communication platforms (Slack, Teams): $8–15/developer/month
-
Code quality and testing tools: $50–150/month
Total monthly infrastructure per developer: $200–$400
Security and Compliance Infrastructure
VPN and security tools: $100–200/developer/month
Data encryption and access controls: Included in security tool budget or $50–100/month additional
Compliance certifications (one-time setup):
-
SOC 2 Type II certification: $15,000–$50,000 (industry range; varies by organization size)
-
ISO 27001 certification: $10,000–$30,000
-
GDPR compliance audit: $3,500–$10,000
For regulated industries (fintech, healthcare), compliance infrastructure adds $1,000–$3,000 per developer annually.
Learn more about SOC 2 compliance costs and ISO 27001 certification.
Bandwidth and Communication Costs
Dedicated communication channels: $200–$500/month for high-quality video conferencing infrastructure beyond standard Zoom/Teams.
Factor 4: Management, Coordination, and Hidden Communication Overhead
One of the largest cost leaks in offshore development comes from management overhead that most organizations fail to budget adequately.
Direct Project Management Costs
Dedicated project coordinator for team >5 developers: $40,000–$70,000 annually.
Percentage-based management overhead: Typically 15-20% of direct labor costs. A team billing $100,000 requires $15,000–$20,000 in management expense.
Communication and Collaboration Overhead
Asynchronous communication tax: For teams with minimal time zone overlap (>8 hours difference), expect 15-20% productivity loss from communication delays. A team theoretically capable of 40 billable hours weekly may deliver only 32-34 hours of effective progress.
Synchronous meeting requirements: Typical offshore team requires 10-12 hours weekly in overlapping communication sessions (standups, code reviews, requirement discussions). For a team in Vietnam working with US-based clients, this may require early morning starts potentially reducing overall productivity by 10-15%.
Context switching costs: Developers context-switching between multiple clients or projects lose 25-30% of productivity. Offshore vendors often structure teams across multiple projects to maximize utilization, creating hidden coordination overhead.
For strategies to manage time zone challenges, read this comprehensive guide.
Onboarding and Ramp-Up Investment
Ramp-up timeline: Average offshore team reaches 85% productivity at 4.6 months; full parity at 7-8 months (compared to 1.8 months for onshore teams).
First-month productivity: Typically 40-50% of expected capacity due to:
-
Environment setup and access provisioning: 40 hours
-
Codebase familiarization: 60 hours
-
Requirement clarification discussions: 20 hours
-
Knowledge transfer sessions: 30 hours
First-quarter impact: Combined, ramp-up costs typically amount to $8,000–$15,000 for a 4-person team, or approximately $2,000–$3,750 per developer.
Ready to cut your software development costs by up to 60% without sacrificing quality or delivery speed?
SmartDev helps enterprises establish Vietnam-based development centers that deliver 60-70% cost savings, accelerated timelines, and world-class code quality - enabling you to reinvest capital into product innovation.
Evaluate your development spend, benchmark Vietnam rates, and design an offshore strategy that maximizes ROI.
Talk to a Development Cost ExpertFactor 5: Quality Assurance and the Rework Reality
Quality assurance represents the single largest hidden cost factor in offshore development, yet organizations consistently underinvest in this area.
Baseline Rework Costs
Industry standard: Approximately 15-26% of total project hours are consumed by rework and defect correction, with some projects experiencing 30-50% rework with poor quality management.
Root causes of offshore rework:
- Requirement misunderstanding (35% of rework): Requirements interpreted literally rather than intentionally
- Code quality issues (25% of rework): Performance problems, scalability failures, or architectural misalignment
- Specification gaps (20% of rework): Missing edge cases or user experience considerations
- Integration challenges (15% of rework): Unexpected conflicts with existing systems
- Communication failure (5% of rework): Repeated implementation of features due to unclear specifications
QA Investment Options and Cost Impact
Minimal QA (Unit Testing Only):
- Cost: 5-8% of development budget
- Defect escape rate: 25-40% of defects reach production
- Post-launch support cost: 30-50% of development budget
- Total First-Year Cost: Development + 40% rework + 40% post-launch support
Standard QA (Unit + Integration + System Testing):
- Cost: 15-20% of development budget
- Defect escape rate: 5-10% of defects reach production
- Post-launch support cost: 5-10% of development budget
- Total First-Year Cost: Development + 15% rework + 8% post-launch support
Comprehensive QA (Including Security and Performance Testing):
- Cost: 20-30% of development budget
- Defect escape rate: <2% of defects reach production
- Post-launch support cost: 2-3% of development budget
- Total First-Year Cost: Development + 5% rework + 2.5% post-launch support
Real-World Impact
A $200,000 development project with minimal QA (saves $30,000 initially) often costs $320,000 total when accounting for rework and post-launch fixes. The same project with standard QA costs $245,000 total—actually cheaper than the minimal QA approach.
Key quality metric: Industry standard defect density is 1 defect per 1,000 lines of code (LOC) deemed acceptable, with top teams achieving <1 defect per 1,000 LOC.

Factor 6: Why Vietnam Represents Superior Value Within Southeast Asia
Within the offshore development landscape, Vietnam occupies a strategic position delivering cost advantages comparable to India while providing operational efficiencies typically associated with nearshore options.
Cost Advantage Benchmarking
Vietnam vs. Japan comparison: System development in Vietnam costs approximately 35% less than Japan. IT personnel salaries average $850-1,400 monthly (junior) versus $3,000-3,500 in Japan for comparable junior/mid-level developers, yet deliver enterprise-grade capabilities.
Vietnam vs. India cost parity with quality advantage: While base hourly rates are similar ($25-50/hour range), Vietnam’s growing talent pool of 650,000+ IT professionals supports selective hiring of higher-caliber developers without rate premiums.
Vietnam vs. China cost comparison: Market data shows Chinese offshore development costs are comparable to Vietnam (China $30-50/hour vs. Vietnam $20-50/hour), not significantly higher as sometimes claimed. However, Vietnam offers advantages in government support for foreign investment and pro-business culture.
Operational Advantages Reducing True Cost
Time Zone Efficiency: Vietnam’s 1-2 hour time difference with Singapore/Japan and 12-13 hour difference with US East Coast enables early morning starts for developers to overlap with business hours. This 2-3 hour daily overlap reduces the asynchronous communication tax that cripples distant offshore partnerships.
Government IT Investment: The Vietnamese government’s National Strategy on Digital Economy aims to make Vietnam a digital powerhouse by 2030, with programs supporting innovation and foreign investments. STEM education through universities (70% have IT faculties) and private training institutions creates consistent access to trained talent.
Infrastructure Stability: By 2024, Vietnam’s internet penetration reached 79.1% overall and 84.7% in urban areas with high-speed connectivity supporting reliable development operations. Power infrastructure supports the data center requirements of modern cloud-native development.
Pro-Foreign Business Culture: Vietnamese professionals demonstrate strong interest in international collaboration and cultural learning. Business culture research indicates favorable disposition toward foreign markets and companies, facilitating smoother team integration compared to some alternative regions.
Industry Recognition: Vietnam consistently ranks among the top 6 global leaders in software outsourcing according to Kearney’s Global Services Location Index, and 2nd position among best destinations in Southeast Asia per Accelerance research.
Vietnam’s Growth Trajectory
The software market in Vietnam is projected to exhibit a growth rate (CAGR) of 10.2% during 2025-2033. Software exports reached $3.5 billion in 2023 and are projected to surpass $4 billion in 2024.
Key growth sectors in Vietnam include:
- Artificial Intelligence (20% CAGR 2022-2028)
- Cloud Computing and DevOps
- Fintech
- E-commerce solutions

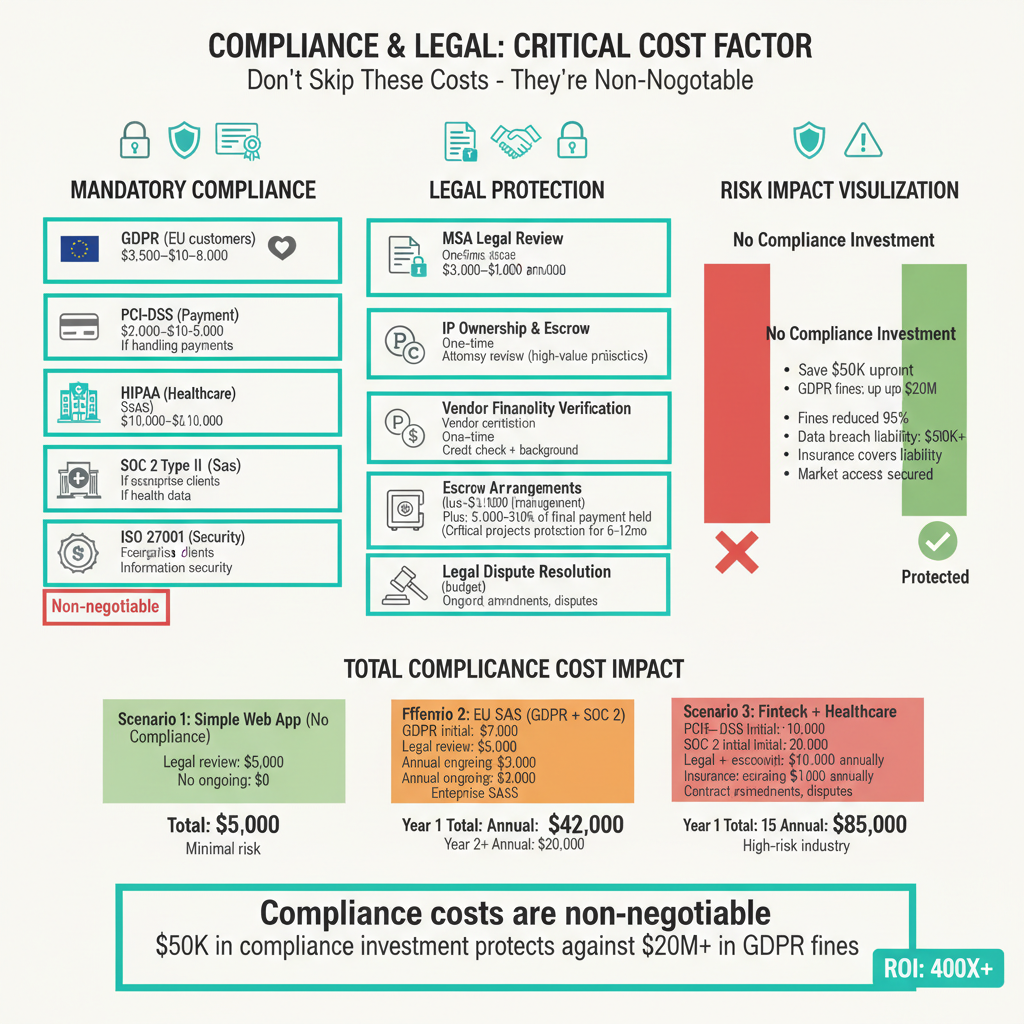
Factor 7: Compliance, Legal, and Risk Mitigation Costs
Overlooking compliance and legal costs creates existential risks that dwarf any hourly rate savings.
Mandatory Compliance Infrastructure
GDPR Compliance (EU customer data): $3,500–$10,000 initial setup; $3,000–$8,000 annual audit and certification maintenance. Non-negotiable for any EU-facing application.
Industry-Specific Certifications:
- PCI-DSS (payment processing): $5,000–$15,000 initial; $2,000–$5,000 annually
- HIPAA (healthcare): $10,000–$30,000 initial; $5,000–$10,000 annually
- SOC 2 Type II (enterprise SaaS): $15,000–$50,000 initial; $5,000–$15,000 annually
- ISO 27001 (information security): $10,000–$30,000 initial; $5,000–$15,000 annually
Legal Protection and IP Safeguards
- Master Service Agreement (MSA) legal review: $3,000–$8,000 for attorney review and jurisdiction specification.
- IP ownership documentation and escrow arrangements: $2,000–$5,000 setup for high-value projects (>$500k).
- Vendor financial stability verification: $500–$1,500 for credit checks and background verification.
Risk Mitigation Overhead
- Insurance and liability protection: Professional liability coverage for development vendors costs $3,000–$10,000 annually; consider requiring this as vendor certification.
- Escrow arrangements for critical projects: Holding 5-10% of final payment ($25,000–$50,000) in escrow for 6-12 months after delivery typically costs $1,000–$3,000 in escrow management fees.
- Change management and legal dispute resolution: Budget $5,000–$15,000 for potential contract amendments and dispute resolution mechanisms.
Factor 8: Total Cost of Ownership Framework and Real-World Calculation
Synthesizing all factors into a practical TCO model provides the framework for accurate budget planning.
TCO Calculation Formula
TCO = (Base Developer Cost × Hours)

+ (Project Management Overhead × 18%)

+ (Infrastructure and Tools Cost)

+ (QA and Testing Investment)

+ (Compliance and Legal Costs)

+ (Contingency for Scope Creep × 12%)
For interactive TCO calculation, explore these resources:
- Full Scale Offshore ROI Calculator
- Glorium Software Development Cost Calculator
- AppCost.AI Calculator
Real-World TCO Examples
Example 1: Simple Mobile App
Base development cost estimate: $80,000
Project duration: 4 months
Team: 2 mid-level developers (Vietnam-based)
Requirements stability: High
| Component | Estimated Cost |
|---|---|
| Base developer cost (400 hrs @ $35/hr) | $80,000 |
| Project management (18% of labor) | $14,400 |
| Infrastructure ($300/mo × 4) | $1,200 |
| QA (15% of labor) | $12,000 |
| Compliance/legal (basic) | $2,000 |
| Contingency (12%) | $10,200 |
| Total Project TCO | $119,800 |
| TCO Uplift | 50% |
Example 2: Complex FinTech System
Base development cost estimate: $250,000
Project duration: 8 months
Team: 3 senior + 2 mid-level developers (Vietnam + onshore PM)
Requirements stability: Medium (Agile evolution expected)
| Component | Estimated Cost |
|---|---|
| Base developer cost (1,600 hrs @ $45/hr) | $250,000 |
| Project management (20% of labor) | $50,000 |
| Infrastructure ($600/mo × 8) | $4,800 |
| QA (20% of labor) | $50,000 |
| Compliance/legal (GDPR, PCI-DSS) | $15,000 |
| Contingency (15%) | $45,000 |
| Total Project TCO | $414,800 |
| TCO Uplift | 66% |
Example 3: Enterprise System with Maintenance
Year 1 development: $400,000
Maintenance (20% of development): $80,000 annually
Team: 4 senior developers + 2 mid-level (Vietnam-based dedicated team)
3-year engagement
| Component | Year 1 | Year 2 | Year 3 | 3-Year Total |
|---|---|---|---|---|
| Development | $400,000 | $80,000 | $80,000 | $560,000 |
| Management (18%) | $72,000 | $14,400 | $14,400 | $100,800 |
| Infrastructure | $7,200 | $7,200 | $7,200 | $21,600 |
| QA (Year 1: 20%, Ongoing: 10%) | $80,000 | $8,000 | $8,000 | $96,000 |
| Compliance | $20,000 | $5,000 | $5,000 | $30,000 |
| Contingency | $50,000 | $11,000 | $11,000 | $72,000 |
| Annual Total | $629,200 | $125,600 | $125,600 | $880,400 |
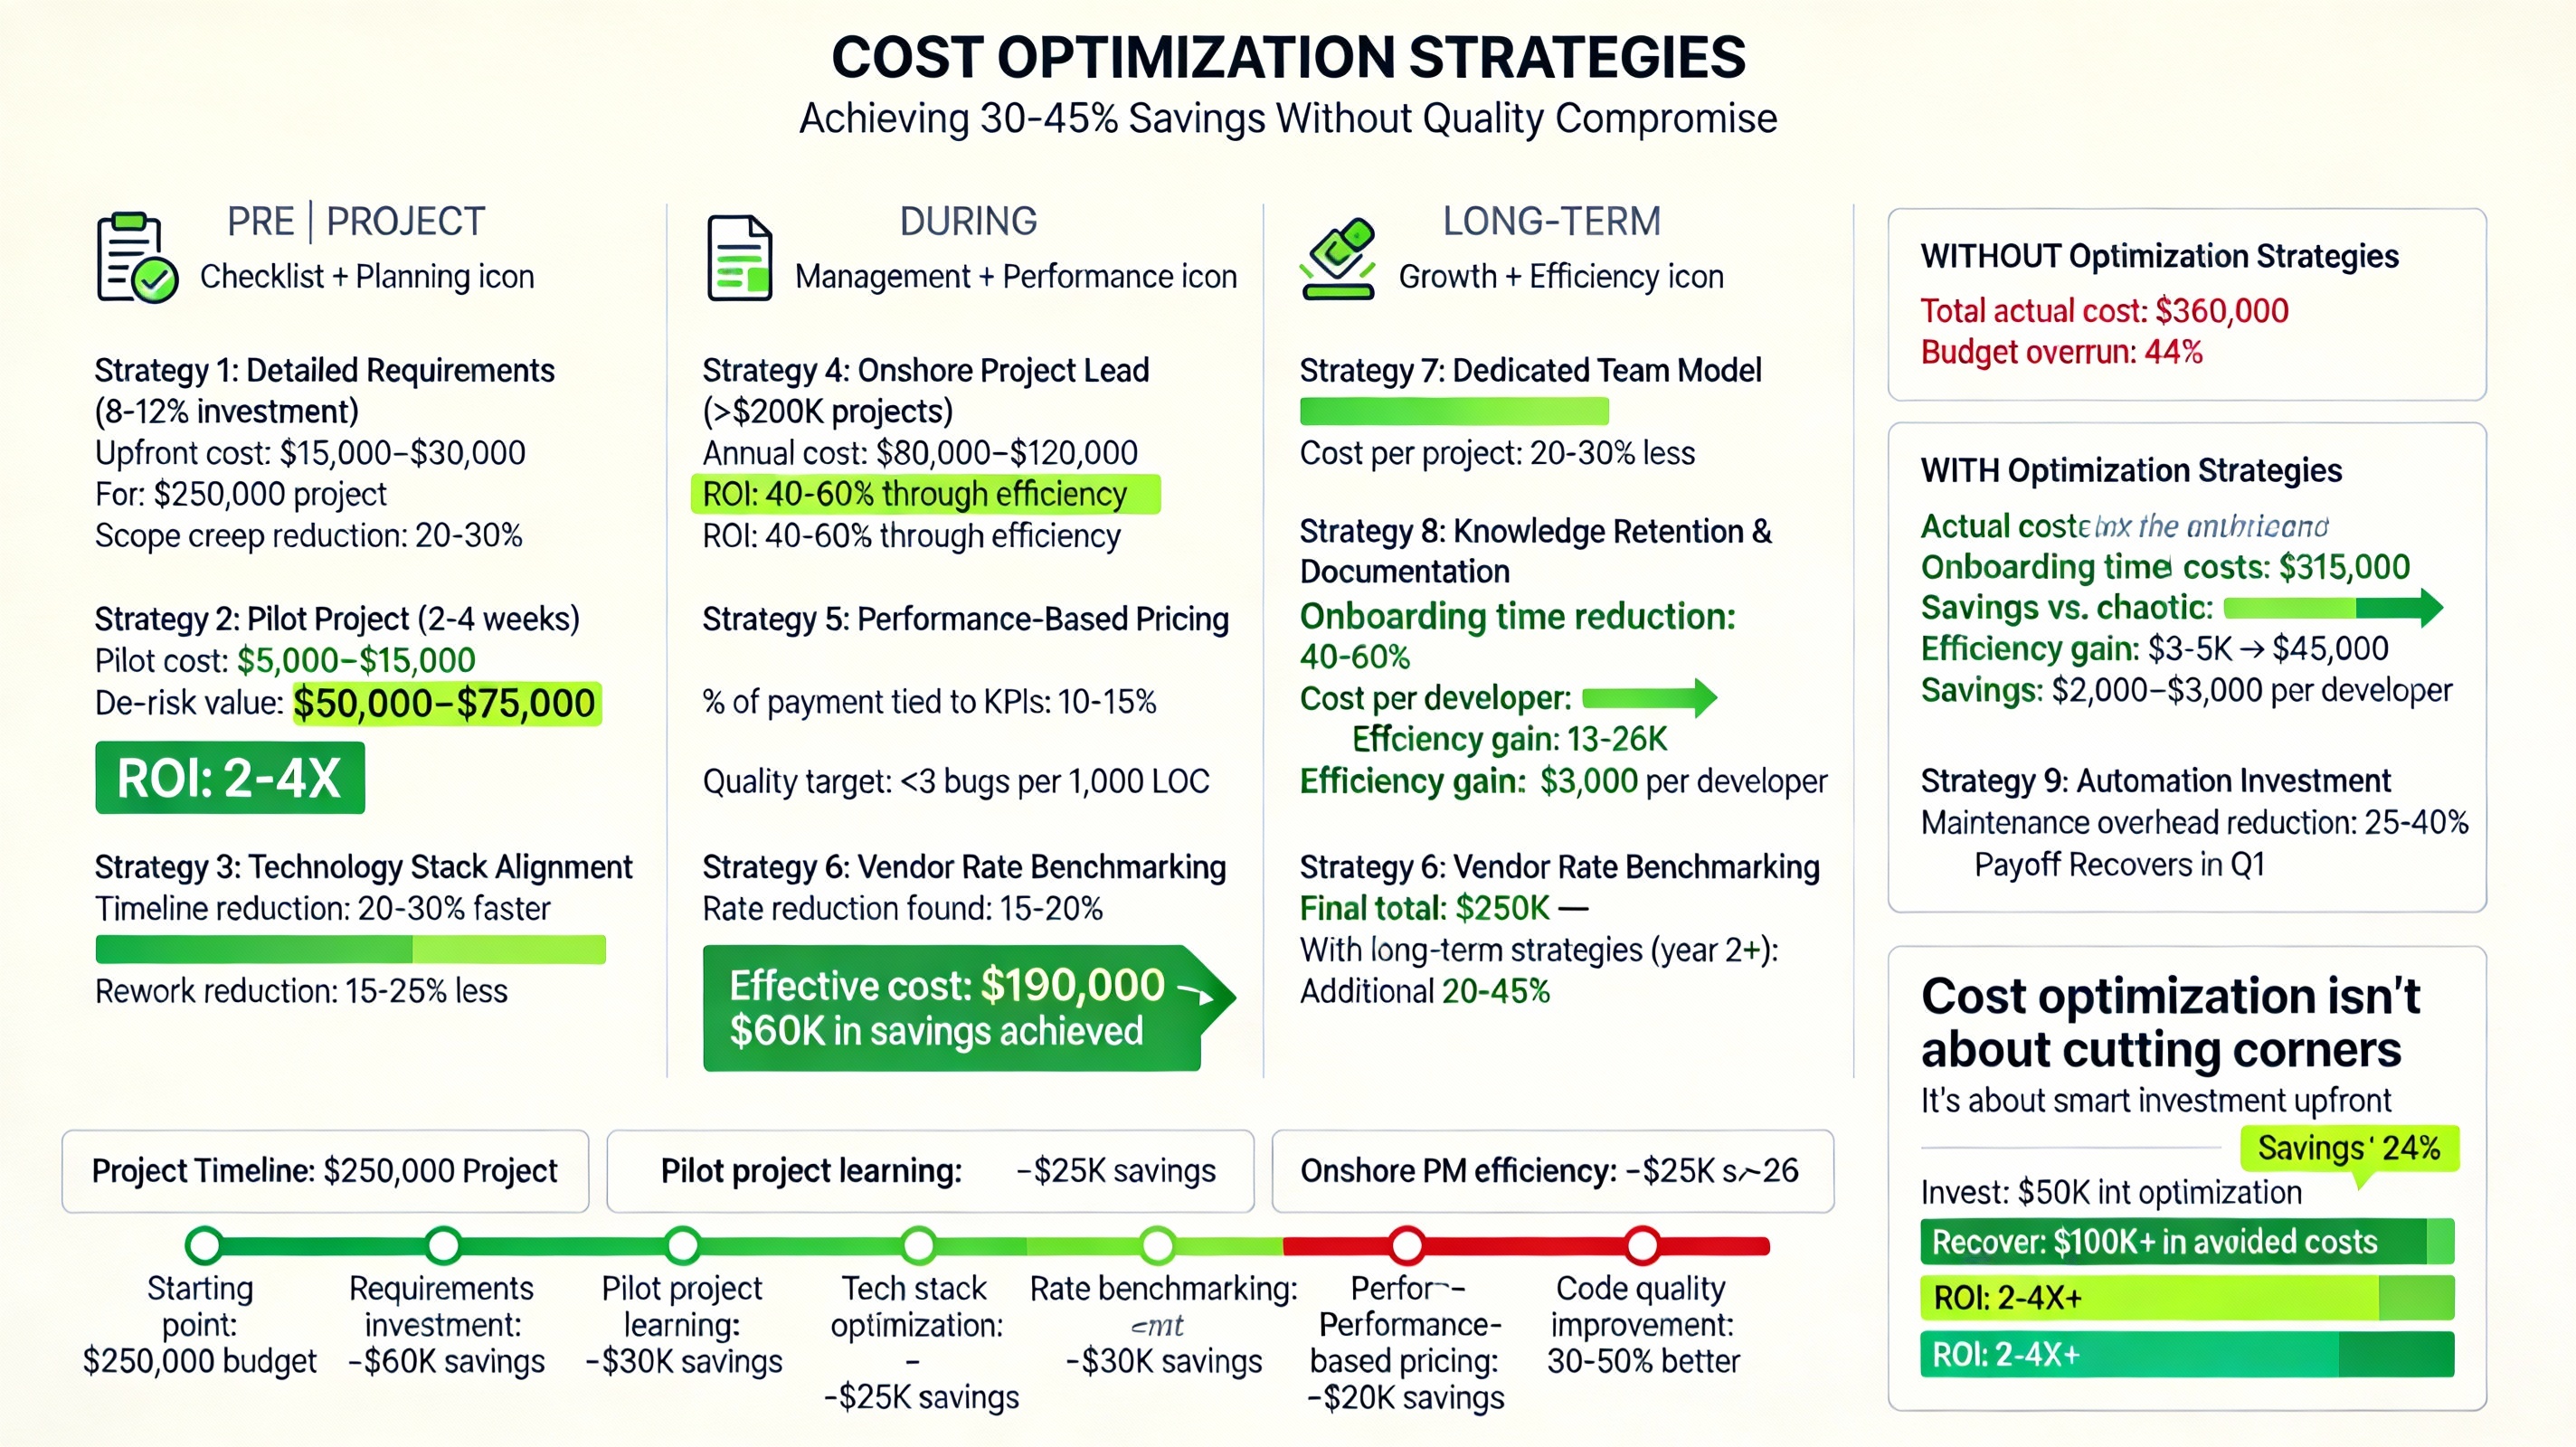
Factor 9: Cost Optimization Strategies—Delivering 30-45% Savings
Strategic approaches to vendor selection and engagement structure deliver measurable cost reductions without quality compromise.
Pre-Project Cost Optimization
1. Detailed Requirements Definition (Invest 8-12% of Budget)
Comprehensive specification documents (wireframes, user stories, technical architecture) cost $15,000–$30,000 upfront for a $250,000 project but reduce scope creep by 20-30%, yielding net savings of $50,000–$75,000.
Learn more about requirements engineering best practices.
2. Pilot Project Approach (2-4 Week Engagement): Starting with a non-critical module ($5,000–$15,000) validates workflow, communication patterns, and code quality before scaling. This de-risks the full engagement and often identifies optimization opportunities worth $30,000+ in avoided costs.
3. Technology Stack Alignment: Selecting technologies where your chosen vendor has deep expertise (rather than forcing emerging technologies for innovation value) reduces delivery timelines by 20-30% and rework by 15-25%.
During-Project Cost Management
4. Dedicated Onshore Lead (Projects >$200k): A single onshore project manager ($80,000–$120,000 annually) reduces communication overhead by 20-30%, accelerates decision-making, and typically delivers 40-60% ROI through efficiency gains.
5. Performance-Based Pricing: Linking 10-15% of final payment to quality KPIs (defect density <3 bugs per 1,000 lines of code, on-time delivery, customer satisfaction &gt;8/10) incentivizes quality while reducing rework costs.
6. Vendor Rate Benchmarking: Comparing offshore rates across 10-15 qualified vendors typically identifies 15-20% rate reduction opportunities without quality sacrifice. The effort (10-15 hours) typically recovers its cost within the first quarter of engagement.
Long-Term Cost Reduction
7. Dedicated Team Model for Ongoing Work: Retaining a dedicated offshore team for multiple projects typically costs 20-30% less per project than sourcing new teams for sequential engagements.
8. Knowledge Retention and Documentation: Systematic documentation and knowledge management reduce onboarding time for new projects by 40-60%, lowering ramp-up costs from $3,000–$5,000 to $1,000–$2,000 per developer.
9. Automation Investment
Implementing CI/CD pipelines, automated testing, and infrastructure-as-code reduces ongoing maintenance overhead by 25-40% and improves code quality metrics by 30-50%.
For comprehensive project management best practices, review these resources:
- Software Project Management Best Practices 2025
- ss=”reset interactable cursor-pointer decoration-1 underline-offset-1 text-super hover:underline font-semibold” href=”https://online.champlain.edu/blog/top-software-project-management-tips” target=”_blank” rel=”nofollow noopener”>Top 10 Software Project Management Tips
- Synoptek Project Management Guide
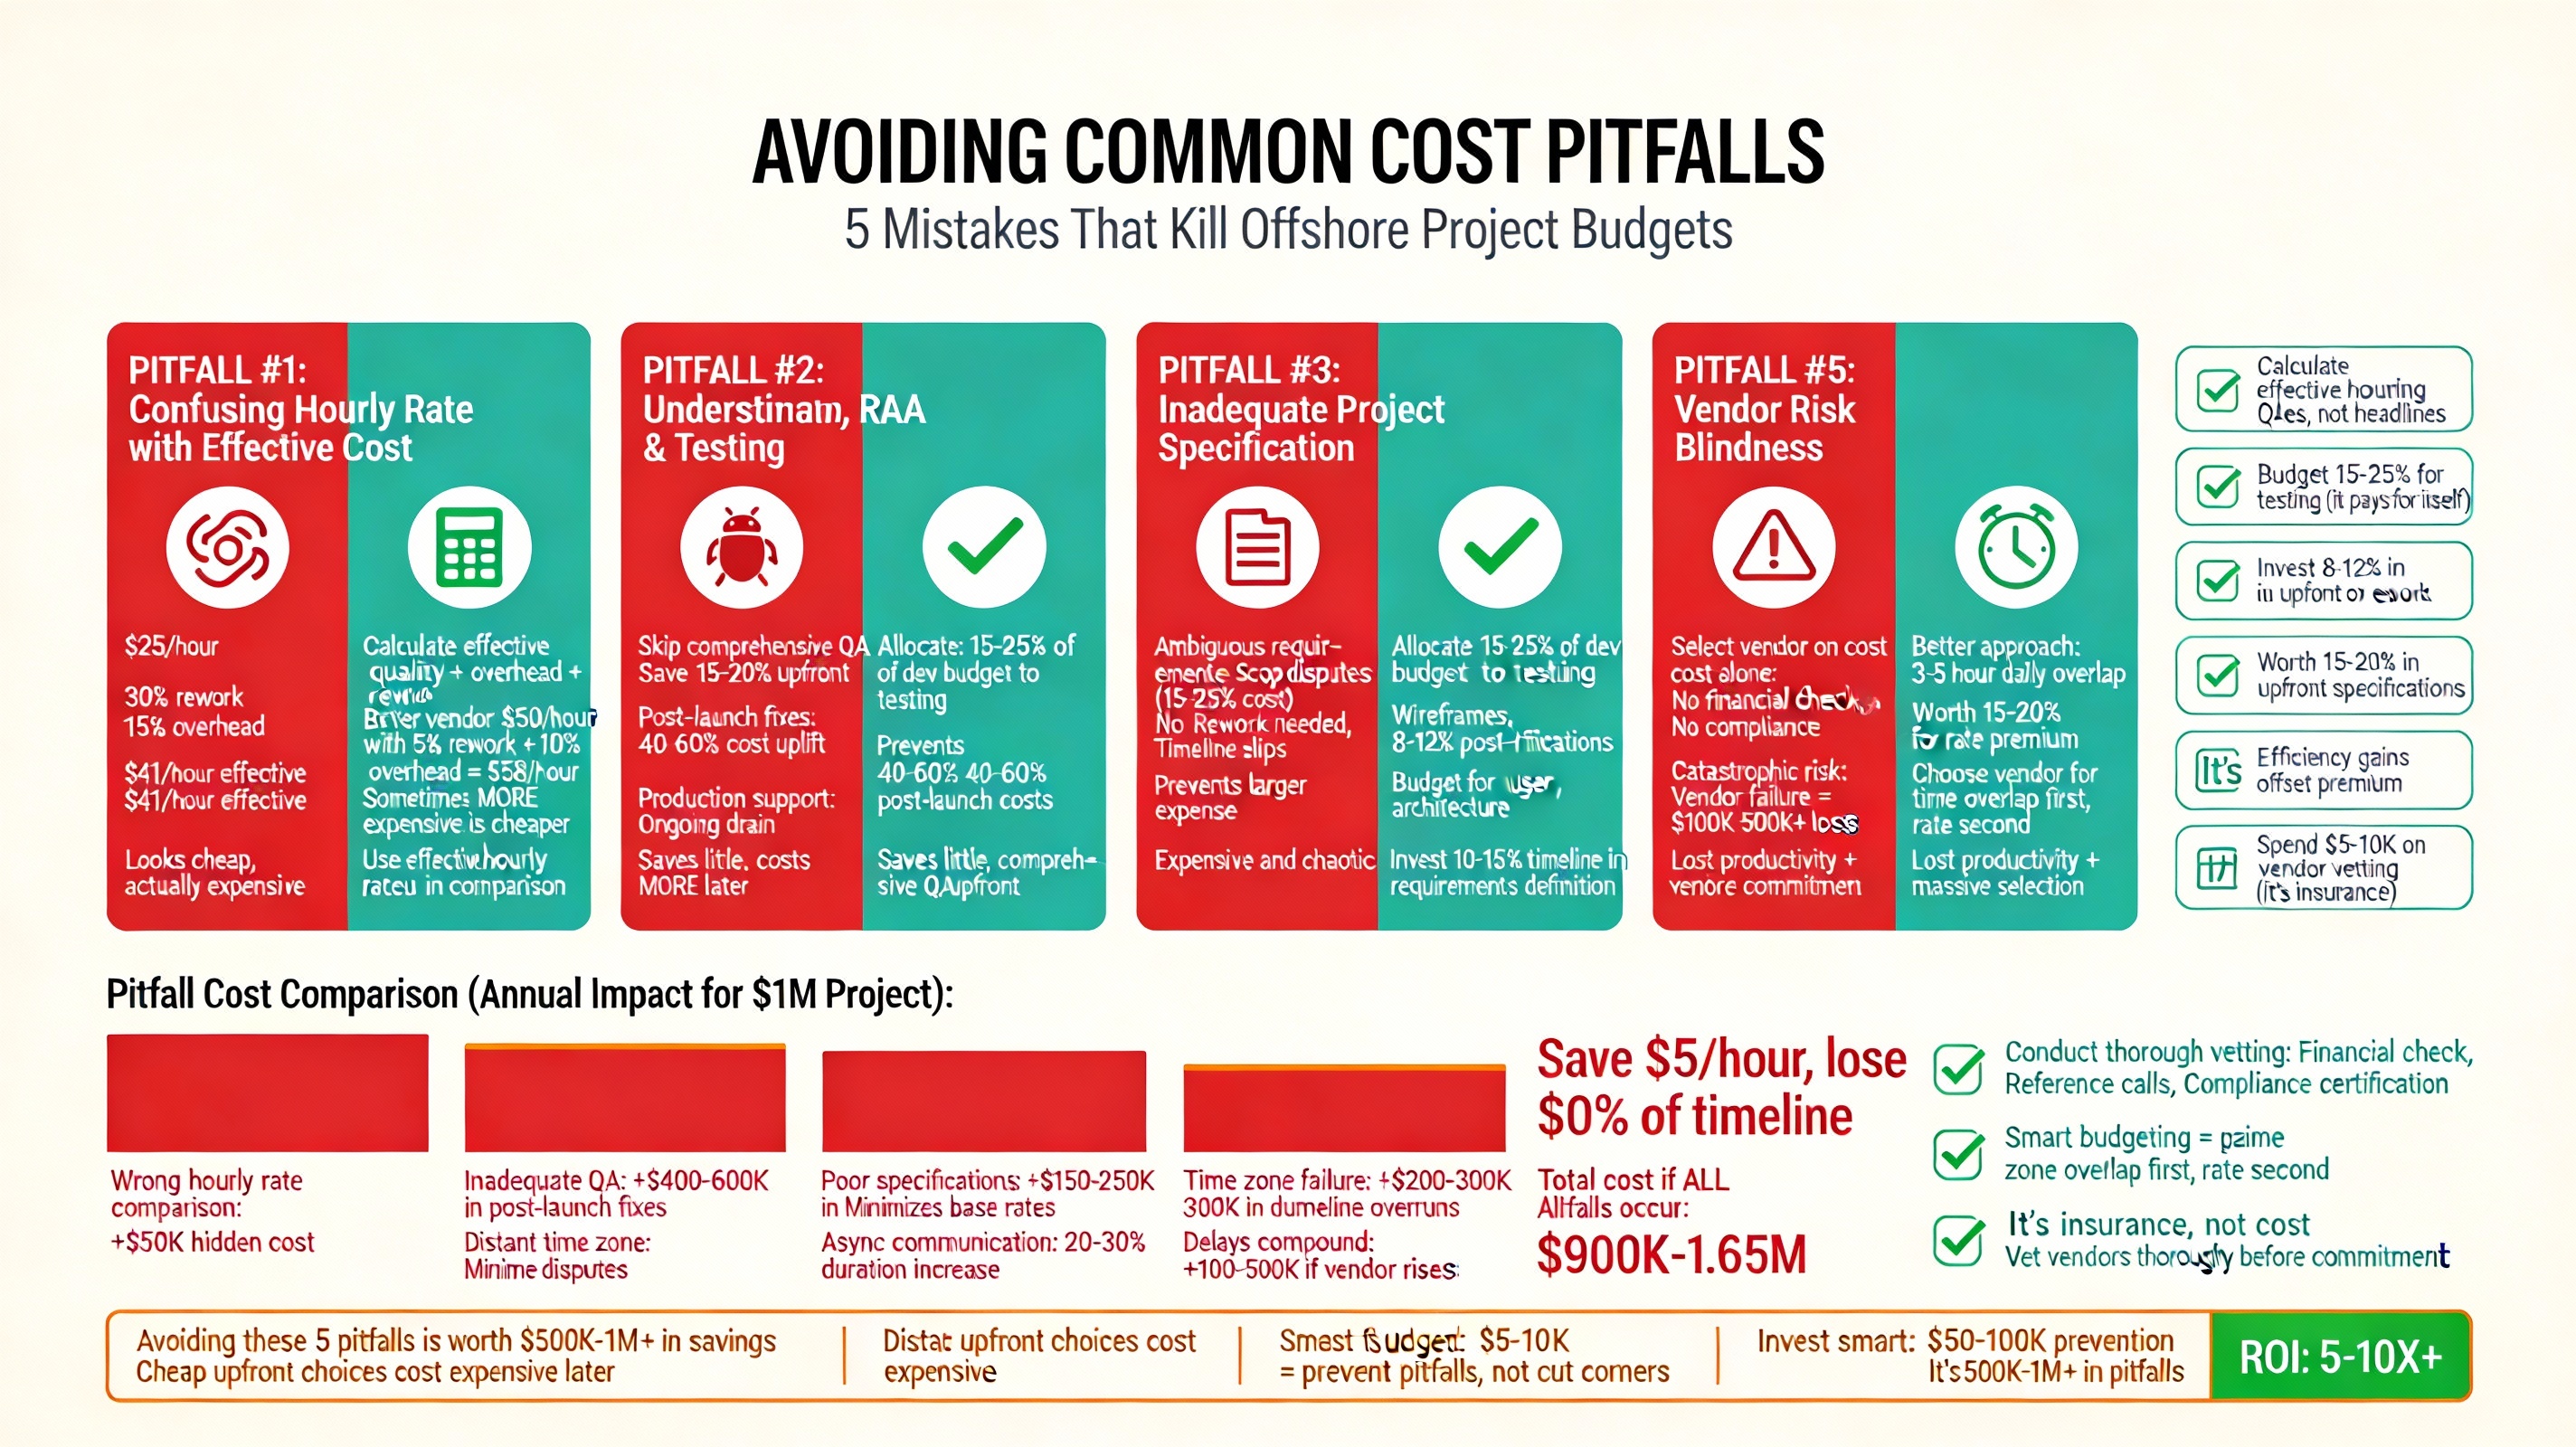
Factor 10: Avoiding Common Cost Pitfalls
Understanding where offshore development budgets typically fail prevents expensive mistakes.
Pitfall #1: Confusing Hourly Rate with Effective Cost
A $25/hour developer with 30% rework and 15% management overhead effectively costs $41/hour. A $50/hour developer with 5% rework and 10% overhead effectively costs $58/hour—sometimes cheaper depending on project characteristics.
Mitigation: Calculate effective hourly rates including quality factors, not headline rates.
Pitfall #2: Underestimating QA and Testing Investment
Skipping comprehensive QA to save 15-20% of budget often results in 40-60% cost uplift from post-launch defect fixes and production support.
Mitigation: Allocate 15-25% of development budget to testing. It’s an investment, not an expense.
Pitfall #3: Inadequate Project Specification
Ambiguous requirements and unclear acceptance criteria create scope disputes representing 15-25% of project cost. Detailed specifications eliminating ambiguity cost 8-12% of budget but prevent the larger expense.
Mitigation: Invest 10-15% of timeline in upfront requirements definition and stakeholder alignment.
Pitfall #4: Time Zone Optimization Failure
Selecting a vendor in a distant time zone to minimize base rates often increases project duration by 20-30% due to asynchronous communication overhead, resulting in higher total cost.
Mitigation: Factor time zone efficiency into vendor selection. A 3-5 hour overlap is worth a 15-20% rate premium.
Pitfall #5: Vendor Risk Blindness
Selecting vendors primarily on cost without financial stability verification, reference checks, or compliance certification creates catastrophic risk exposure. Failed vendor transitions cost $100,000–$500,000+ in lost productivity and rework.
Mitigation: Conduct thorough vendor vetting. Budget $5,000–$10,000 for diligence. It’s insurance.
Actionable Budget Planning Framework
Step 1: Define Project Baseline
- Estimated development hours
- Team composition (junior/mid/senior ratio)
- Technology stack requirements
- Regulatory compliance needs
Step 2: Select Engagement Model
- T&M for high uncertainty (apply 20% rate premium)
- Fixed-price for stable requirements (apply 15% risk premium)
- Dedicated team for >6 month engagements (calculate monthly retainer)
Step 3: Select Geography
- Vietnam for balanced cost-quality (mid-range rates, high quality, strong government support)
- Eastern Europe for complex architecture (higher rates, minimal supervision, time zone overlap with EU)
- India for largest talent pool (varied rates, requires careful vendor selection)
- Latin America for US nearshore (time zone overlap, cultural alignment)
Step 4: Calculate Component Costs
- Base labor (hours × rate)
- Management overhead (+18-20%)
- Infrastructure (+$300-600/developer/month)
- QA (+15-25%)
- Compliance (+5-10%)
- Contingency (+12-15%)
Step 5: Validate TCO and Compare Alternatives
- Benchmark effective rates against onshore alternatives
- Factor multi-year maintenance and support costs
- Conduct sensitivity analysis on key assumptions
2026 Offshore Development Trends to Watch
As you plan your offshore strategy, consider these emerging trends shaping the landscape:
- Increased Adoption of Cloud-Native Development: Industry forecasts show cloud-native development is becoming a baseline requirement, with offshore teams increasingly proficient in Kubernetes, Docker, and microservices architecture.
- AI and Automation Integration: Vietnam’s software development sector is experiencing 20% CAGR growth in AI (2022-2028), with offshore teams rapidly adopting AI-powered development tools and low-code platforms.
- Outcome-Based Partnerships: CTOs increasingly prefer measuring business outcomes over billable hours, driving a shift toward shared accountability and transparent delivery models.
- Enhanced Security and Compliance: With the BFSI sector accounting for 24.3% of offshore development, security certifications and compliance infrastructure are becoming standard requirements.
- Remote-First Development Models: The remote work revolution enables Vietnamese teams to collaborate with global clients without fixed offices, cutting costs and boosting flexibility.
Conclusion
The true cost of offshore software development extends far beyond hourly rates published in vendor catalogs. Organizations succeeding with offshore development recognize cost as a multifaceted equation encompassing labor, infrastructure, management, quality, compliance, and contingency—typically adding 25-150% to headline development costs.
This comprehensive costing framework enables accurate budgeting during procurement and planning phases. More importantly, it reveals where strategic decisions: vendor selection, engagement model choice, investment in upfront specification and QA deliver measurable cost optimization without quality compromise.