
TL;DR
- Monitor model outcomes, input data, predictions, calibration, cohorts, data quality, and business results. One metric cannot describe the health of a production ML system.
- Treat drift alerts as investigation triggers, not automatic retraining commands.
- Check pipelines, schemas, labels, instrumentation, and metric definitions before concluding that the model has degraded.
- Choose retraining cadence and model-update method separately. Scheduled retraining, event-triggered retraining, full rebuilding, incremental learning, and fine-tuning solve different problems.
- Do not deploy a retrained model because its average test score improved. Require data, performance, cohort, robustness, operational, governance, and rollback evidence.
- Assign owners, approval gates, incident procedures, model lineage, and review cadences before a material drift incidentroduction
Introduction
A deployed machine learning model does not stay accurate by default. After release, production data evolves, user behaviour shifts, and the statistical relationships a model learned during training stop reflecting reality. The model keeps running, keeps returning predictions — but those predictions become progressively less reliable. This degradation is an inherent byproduct of AI model development.
The instinct many teams act on is to retrain. That instinct is often correct, but it is not always the right first response. A monitoring alert may reflect a data-pipeline failure, a schema change, a labelling lag, or an instrumentation defect — not model drift at all. Retraining a model whose pipeline is broken wastes compute, creates deployment risk, and leaves the underlying problem untouched.
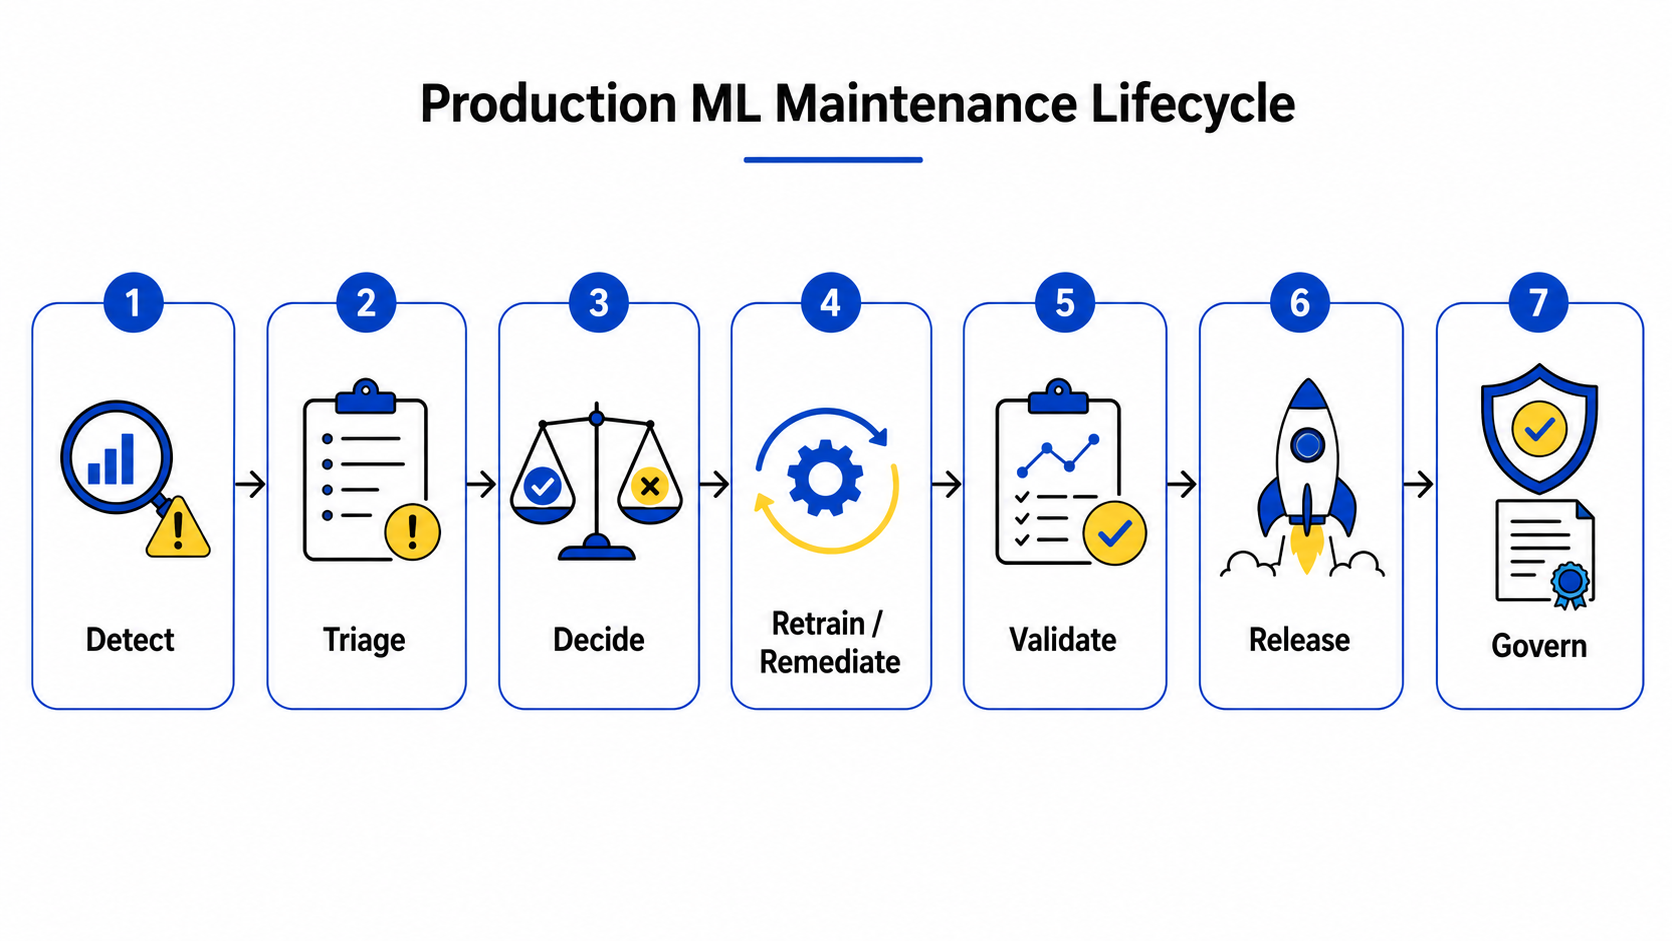
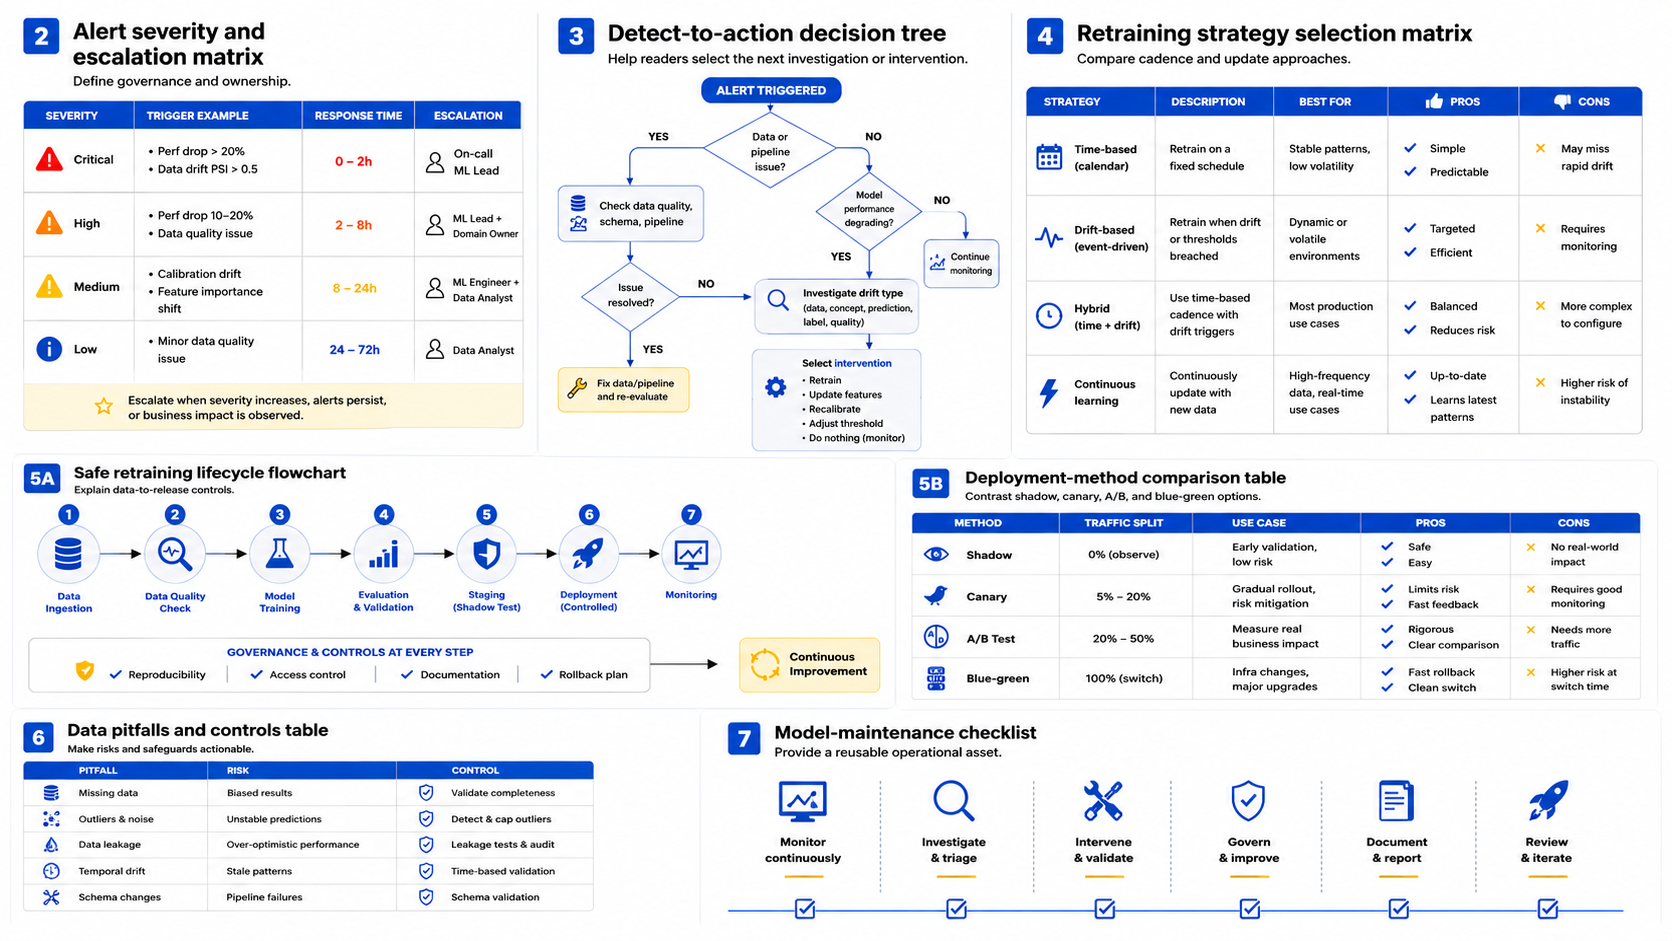
A reliable maintenance process connects seven activities: Detect → Triage → Decide → Retrain or remediate → Validate → Release → Govern
This guide follows a specific sequence: detect, triage, decide, retrain, validate, release, govern. Each stage has entry and exit criteria. The goal is a proportionate response to evidence — not a fixed retraining reflex.
1. Model Drift in Production: What Fails and Why It Matters
Model drift occurs when changes in production conditions reduce a deployed model’s reliability, predictive performance, calibration, fairness, or business usefulness over time.
The model code may remain unchanged. What changes is the environment around it: incoming data, user behavior, target relationships, data collection, available labels, business processes, or operational infrastructure.
What Is Model Drift? The Phenomenon Destroying Your ML ROI
AI model drift is a change that causes a deployed model’s reliability, accuracy, calibration, or business usefulness to decline over time. The decline occurs without code changes. The model continues executing normally, but the data it encounters in production diverges from the data it was trained on — or the relationship between inputs and the target outcome has itself changed.
A simple example: A credit-risk model trained on customer data from 2021–2023 performed well at deployment. By late 2024, economic conditions had shifted, new credit products had appeared, and the customer mix had changed. The model’s code had not changed. Its training data had not changed. But its predictions had drifted out of alignment with current reality.
Drift differs from application outages and software defects. The system is healthy. The model is running. The degradation is statistical, not operational — which is why it often goes undetected until business impact becomes visible.
This model drifts in its most common form. And it’s why production of AI maintenance isn’t optional; it’s essential.

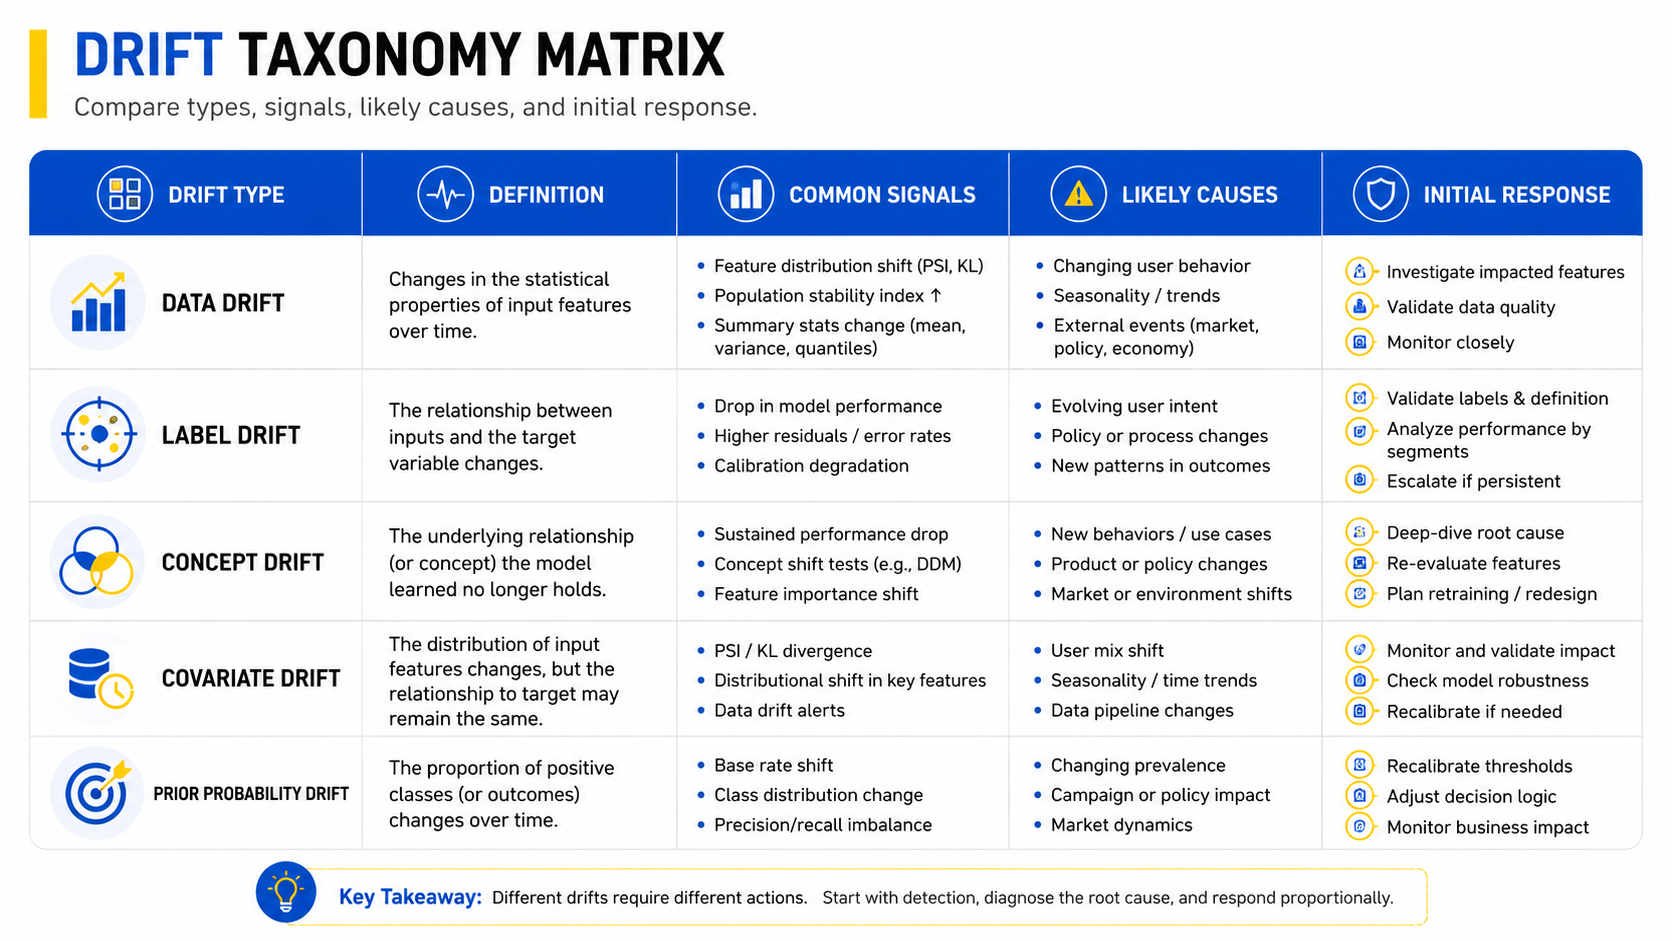
The model-drift taxonomy: data, concept, prediction, label, schema, and data-quality drift
Real incidents may involve several drift types simultaneously. The table below maps each type to its observable signals and an appropriate initial response. Use it as a diagnostic starting point, not a mutually exclusive classification.
| Drift type | What changes | Observable signal | Likely business impact | Initial response |
|---|---|---|---|---|
| Data drift (covariate shift) | Statistical distribution of input features shifts relative to training | PSI, KS test, or JS divergence on features exceeds the defined threshold | The model encounters inputs outside its learned distribution, potentially degrading performance | Measure the distribution shift and check whether downstream performance confirms degradation |
| Concept drift | The relationship between input features and the target variable changes | Performance degrades even when input distributions remain stable; calibration worsens | Predictions become systematically incorrect because real-world patterns have changed | Investigate feature–target correlations; the model may require feature redesign or rebuilding |
| Prediction drift | Distribution of model outputs shifts from the training-period baseline | Output mean, variance, or percentile distribution changes significantly | The model may be encountering out-of-distribution inputs, or its confidence may be miscalibrated | Compare the output distribution with the training baseline and validate it when labels become available |
| Label drift | Distribution or quality of ground-truth labels changes | Evaluation metrics fluctuate without input changes; labelling accuracy decreases | Training and evaluation signals become unreliable | Audit the labelling process and check for changes in annotation procedures or rater behaviour |
| Schema drift | Input feature schema changes, such as new fields, renamed columns, removed features, or data-type changes | Pipeline errors, missing-value spikes, or sudden changes in feature importance | The model receives malformed inputs, making predictions potentially meaningless | Validate the schema against the production feed and update validation contracts |
| Data-quality drift | Input data quality degrades, such as increasing missing values, accumulating outliers, or changes in upstream data collection | Data-quality metrics worsen; null rates rise; distributions shift in ways inconsistent with real-world changes | A model trained on clean data underperforms when exposed to degraded inputs | Run a data-quality audit and trace the issue to the relevant upstream collection or pipeline stage |
*Source references: PSI and KS test usage in production ML monitoring — IBM Think: Model Drift; distribution monitoring approaches — Domino Data Science Dictionary: Model Drift.
How model drift affects revenue, risk, customer experience, and compliance
Drift consequences vary by use case. The claims below are qualified by use case rather than stated as universal.
- Revenue impact (recommendation and pricing systems): When a recommendation model’s output distribution drifts, click-through rates and average order value decline. When a pricing model’s feature distributions shift, margin optimisation degrades.
- Risk impact (fraud detection and credit decisioning): In fraud detection, concept drift — where fraudsters change their patterns — causes false-negative rates to rise. Missed fraud creates direct financial losses and can trigger regulatory scrutiny. In credit decisioning, data drift can cause risk scores to become miscalibrated.
- Customer experience impact (personalisation and service systems): Users notice when recommendations become irrelevant, when chatbot responses become inaccurate, or when personalisation disappears. Degraded experience increases churn in environments where alternatives are accessible.
- Compliance and fairness impact (high-stakes decisioning): Models used for lending, hiring, insurance, or other consequential decisions must maintain performance consistency across demographic cohorts. Drift can cause fairness metrics to degrade unevenly. See: EU AI Act and model-risk guidance from financial regulators (e.g., US OCC SR 11-7, UK FCA model risk principles).
- Operational cost impact: Without automated monitoring, drift manifests as support tickets, manual investigations, and emergency retraining cycles. These costs scale with the number of production models.
When drift is not the problem: distinguish model degradation from data-pipeline and measurement failures
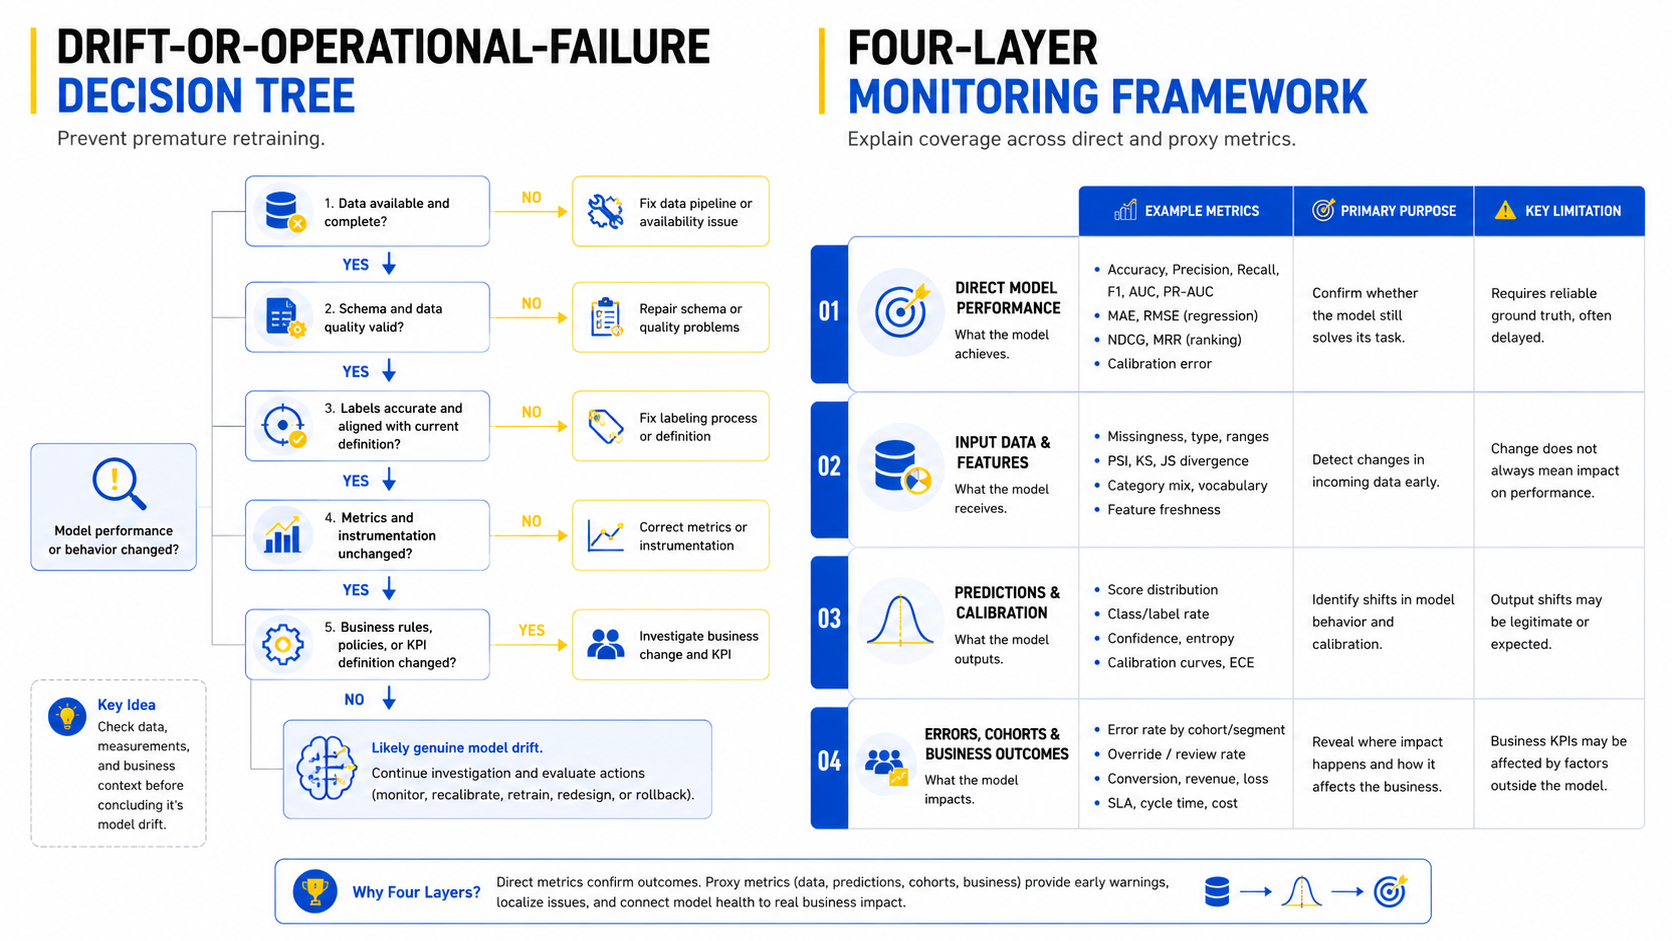
A monitoring alert is evidence that something has changed — not confirmation that the model has drifted. Before initiating any retraining, work through this diagnostic checklist. First-response diagnostic checklist:
- Check data-pipeline integrity. Are expected data volumes arriving on schedule? Are upstream sources returning valid schemas? A broken ETL job can cause null spikes that look like data drift.
- Validate schema against production feed. Has any upstream team added, removed, renamed, or retyped a field? Schema drift triggers performance alerts but is resolved at the pipeline layer, not by retraining.
- Check label availability and quality. Have labels started arriving later than usual? Has the labelling process or annotation team changed? Delayed or corrupted labels produce misleading evaluation metrics.
- Confirm the metrics definition has not changed. Has the business metric being tracked (conversion rate, fraud flag, click) been redefined? A definition change produces apparent degradation where none exists in model behaviour.
- Isolate the affected cohort. Is the alert global or segment-specific? A segment-specific alert points to a data-collection issue, a demographic shift, or a business change affecting that segment — not necessarily the model.
- Check for tracking and instrumentation changes. Have analytics tags, event schemas, or data-collection libraries changed? Instrumentation changes produce distribution shifts in logged features that do not reflect real-world change.
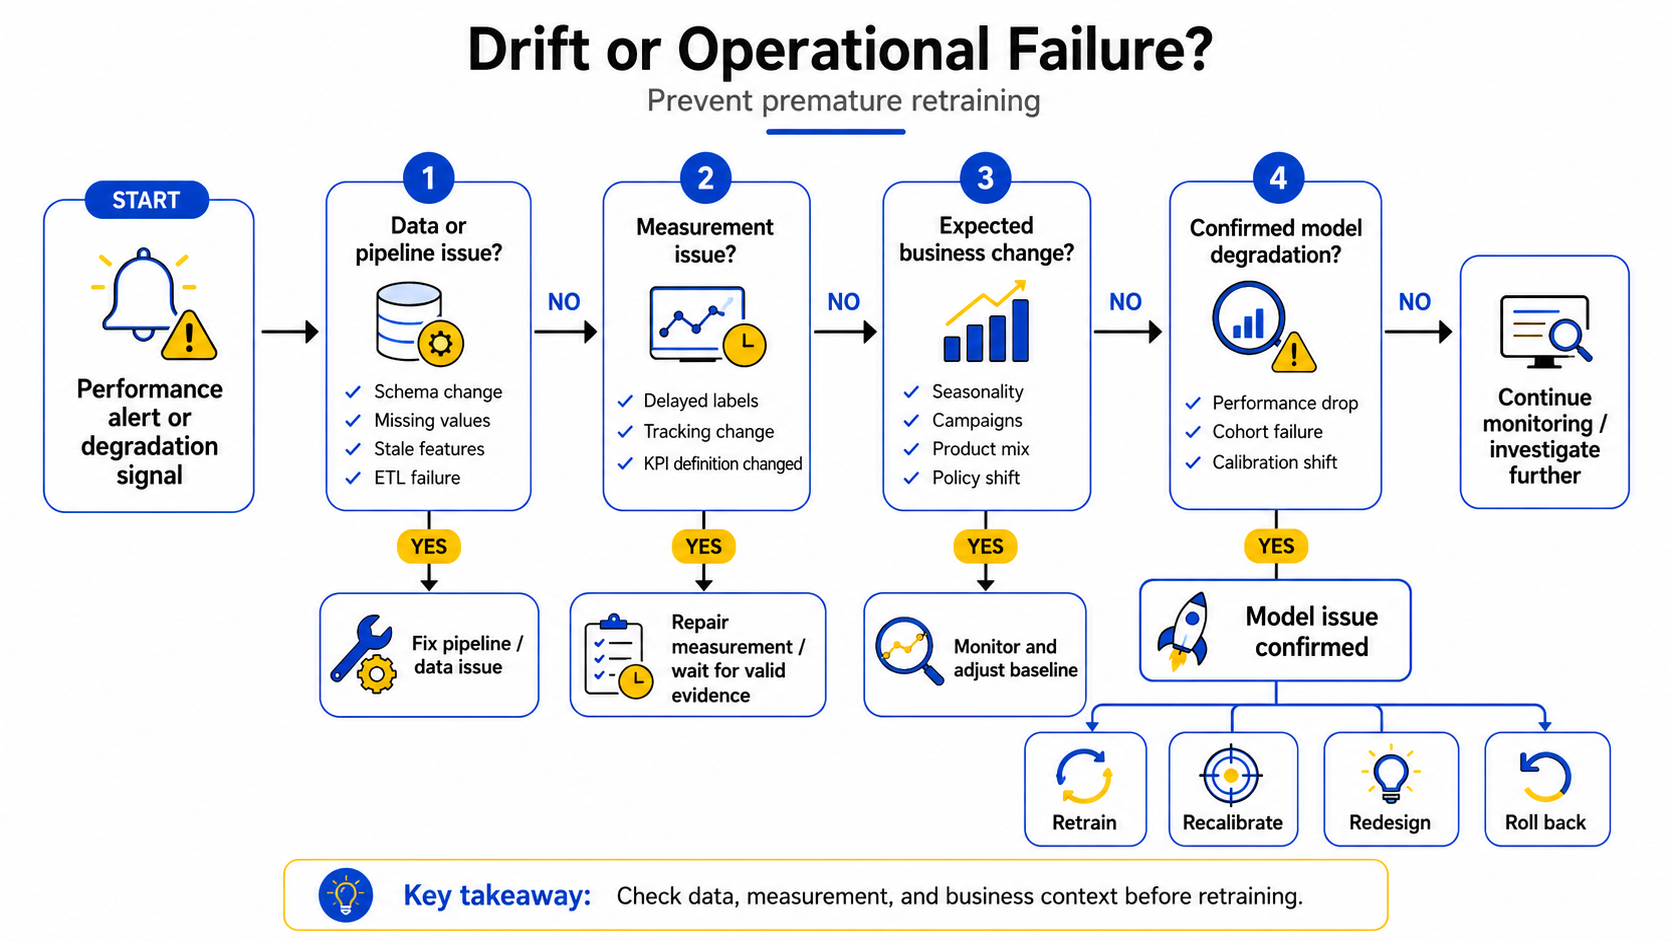
Only after ruling out these upstream causes should the investigation pivot to model-level drift and the retraining decision.
2. Build the Monitoring Foundation Before You Need Retraining
Reliable retraining decisions require monitoring infrastructure that already exists before a problem occurs. A team that builds its first monitoring dashboard in response to a production incident is starting too late.
The four monitoring layers for production ML systems
No single metric is sufficient. The four layers below work together: direct performance confirms actual degradation; proxy layers warn of likely degradation when labels are not yet available.
| Layer | What it measures | Timing | Key limitation | Action owner |
|---|---|---|---|---|
| 1. Direct model-performance metrics | Task-level accuracy, precision, recall, F1, AUC, RMSE, MAE, MAPE, and NDCG compared with the baseline | Depends on label availability; often daily or weekly | Requires ground-truth labels and cannot be used effectively when labels are delayed | ML engineer or model owner |
| 2. Input-data and feature-distribution metrics | Statistical distribution of each feature and schema conformance | Daily or near real time | Confirms that inputs have changed, but does not prove that model performance has degraded; it is only a proxy signal | Data engineer or ML engineer |
| 3. Prediction-distribution and calibration metrics | Distribution of model outputs, confidence calibration, and out-of-distribution detection | Daily or near real time | Confirms that outputs have changed, but does not prove an actual loss of accuracy; it is only a proxy signal | ML engineer |
| 4. Error-pattern, cohort, and business-outcome metrics | Error rates by segment, fairness metrics, and business KPIs such as conversion rate, fraud loss, and investigation time | Weekly or per release | Aggregate metrics may conceal failures affecting specific cohorts or segments | ML engineer and domain or product owner |
Limitation note for proxy layers: Distribution shifts and prediction shifts are warning signals. They do not prove model performance has degraded. Treat them as evidence warranting investigation, not as confirmed drift.
Direct model-performance metrics
The right metric depends on decision cost, not technical convenience. For classification: use F1 or AUC when class imbalance is present; use accuracy only when classes are balanced and misclassification costs are symmetric. For regression: use MAE when outliers should not dominate; use RMSE when large errors carry disproportionate business cost; use MAPE when relative error matters more than absolute error. For ranking systems: use NDCG when position matters.
Input-data and feature-distribution metrics
Feature distribution monitoring provides early warning when labels are unavailable. Key techniques:
- Population Stability Index (PSI): Measures distribution shift between training and production for a given feature. PSI values above 0.1 warrant attention; values above 0.25 warrant investigation and possible escalation. Note: PSI thresholds are context-specific starting points — high-volatility features may tolerate higher PSI; low-variance features may warrant action at lower values. (Source: standard PSI interpretation; Domino Data Science Dictionary)
- Kolmogorov-Smirnov (KS) test: Non-parametric test comparing production feature distribution to training baseline.
- Jensen-Shannon (JS) divergence: Symmetric, bounded divergence measure; useful for comparing multivariate distributions.
- Schema validation: Validate field names, types, and null rates on every data batch before it reaches the model.
Prediction-distribution and calibration metrics
Output shifts can reveal concept drift or out-of-distribution inputs before label-based metrics can confirm performance loss.
A classifier is well calibrated when predictions assigned a probability near 0.8 are correct at approximately that rate over an appropriate sample. Calibration should be measured on data not used to fit the model or its calibrator.
Prediction drift is still a warning signal, not proof of failure. It may reflect a legitimate change in the population or business process.
Error-pattern, cohort, and business-outcome metrics
Aggregate performance metrics can conceal failures in high-value, regulated, or vulnerable cohorts. A model with stable overall accuracy may have severe degradation in a minority segment, a new geographic market, or a recently-acquired customer cohort. Recommended monitoring practices:
- Segment error rates by business-critical dimensions (geography, customer segment, product type, acquisition channel).
- Track fairness metrics (demographic parity, equal opportunity) for models used in consequential decisions.
- Monitor business outcomes tied to model quality: fraud loss rate, conversion rate, average revenue per prediction, investigation time.
- Include high-value, regulated, and vulnerable cohorts in every review — not just in compliance audits.
Establish baselines, owners, review cadence, and alert severity
Metrics without owners and escalation paths produce noise, not accountability.
Baseline: Establish the performance baseline over a 15–30 day stable production window after deployment. The baseline should be representative of typical operating conditions — not peak periods or anomalous weeks.
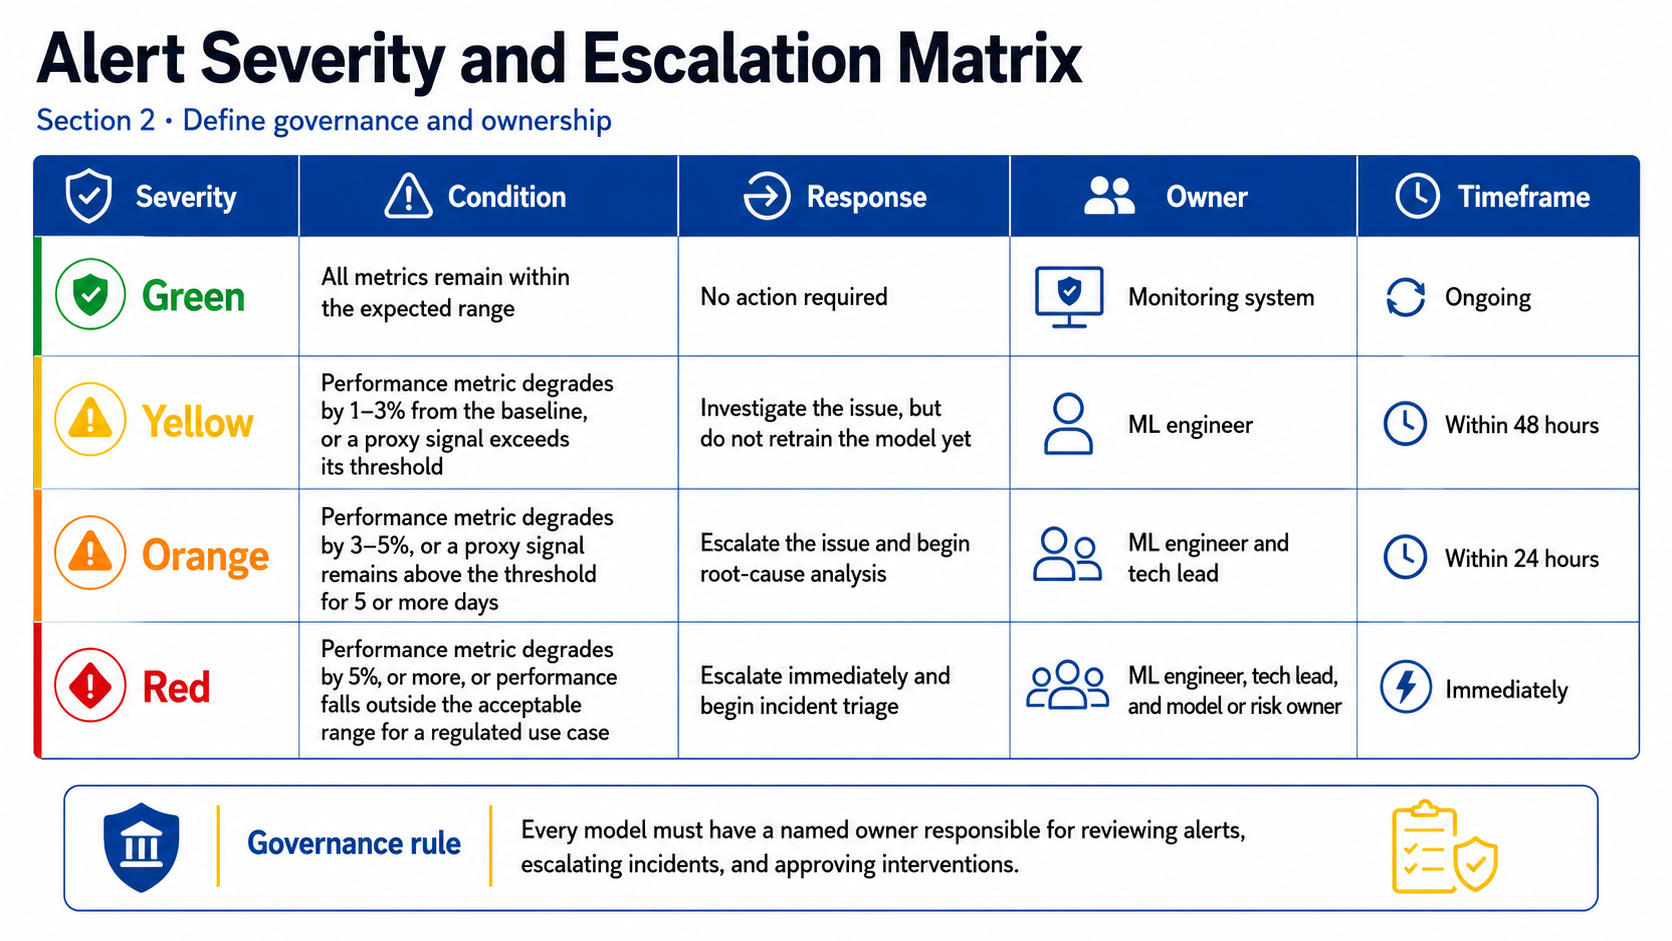
Alert Severity and Escalation Matrix
| Severity | Condition | Response | Owner | Timeframe |
|---|---|---|---|---|
| Green | All metrics remain within the expected range | No action required | Monitoring system | Ongoing |
| Yellow | Performance metric degrades by 1–3% from the baseline, or a proxy signal exceeds its threshold | Investigate the issue, but do not retrain the model yet | ML engineer | Within 48 hours |
| Orange | Performance metric degrades by 3–5%, or a proxy signal remains above the threshold for 5 or more days | Escalate the issue and begin root-cause analysis | ML engineer and tech lead | Within 24 hours |
| Red | Performance metric degrades by 5% or more, or performance falls outside the acceptable range for a regulated use case | Escalate immediately and begin incident triage | ML engineer, tech lead, and model or risk owner | Immediately |
Cadence: Daily automated checks for all proxy and performance metrics. Weekly human review of trends and segment-level performance. Per-release review comparing new model to production baseline.
Ownership rule: Automated alerting is not a substitute for human accountability. Each model must have a named owner who is responsible for reviewing alerts, escalating incidents, and approving interventions.
Choose a monitoring operating model: build, platform, or hybrid
| Operating model | When to use | Key trade-offs |
|---|---|---|
| Build (open source) | Best for a single team that needs bespoke metrics, full control, or strict compliance restrictions on data leaving the environment | Requires substantial engineering investment, but provides full customisation and avoids vendor dependency |
| Platform (commercial) | Best for organisations managing multiple models, using standard monitoring use cases, lacking dedicated MLOps capacity, or requiring rapid deployment | Enables faster time to monitoring, but introduces recurring costs and constraints based on vendor capabilities |
| Hybrid | Best when custom metrics must be combined with standard monitoring and alerting, or when only part of the environment has strict compliance requirements | Balances flexibility and speed, but requires additional integration and maintenance work |
Selection criteria: model volume, deployment environment, observability maturity, data residency and compliance requirements, label availability, and engineering capacity. Do not evaluate platforms on feature lists alone — verify claimed capabilities against your specific use case and environment before committing.
3. Detect Drift, Triage the Signal, and Decide What to Do
A layered drift-detection approach
Detecting model drift requires combining multiple signals. No single metric perfectly identifies when retraining is needed. Instead, implement a layered approach where multiple signals increase confidence that drift has occurred.
| Evidence tier | Signal type | Strength | Action |
|---|---|---|---|
| Direct outcome evidence | Model-performance degradation confirmed using an adequate volume of ground-truth labels | Strong | Proceed to incident triage and determine the appropriate response |
| Proxy evidence | Input-distribution shift, measured through PSI or KS tests, or a sustained shift in the prediction distribution | Moderate | Investigate and gather corroborating evidence; do not retrain the model based on this signal alone |
| Diagnostic evidence | Changes in error patterns, cohort-level divergence, or movement in business metrics | Contextual | Combine with evidence from other monitoring layers; use primarily to isolate the root cause |
Performance degradation signals
Direct performance decline is the most important signal — but it requires adequate labels and statistically meaningful measurement. Before declaring confirmed performance loss:
- Verify that the evaluation window contains sufficient observations for the metric to be statistically reliable.
- Confirm labels are complete for the evaluation period (no systematic delay or truncation).
- Check that the evaluation dataset matches production distribution (not a stale holdout).
- Segment the decline: is it global or concentrated in one cohort?
A global decline with adequate labels and clean data is strong evidence of drift. A cohort-specific decline warrants investigation into that cohort’s data pipeline before retraining is considered.
Data Distribution Changes
When you can’t wait for labeled data, distribution changes provide early warning signs. Implementation:
- Calculate PSI for important features daily
- Set thresholds: investigate PSI > 0.1, alert PSI > 0.25
- Track trends-gradually increasing PSI indicates creeping drift; sudden jumps indicate sudden changes
- Compare recent production data against training data distribution
Example detection: A churn prediction model might detect:
- Customer age distribution changing (younger customers increasing)
- Subscription contract term distribution changing
- Usage pattern distribution changing
Interpretation: These distribution changes indicate that the customers the model is scoring are different from the customers it was trained on. Model retraining may be needed.
Prediction Distribution Shifts
When model output distributions change significantly from training, the model is scoring different data. Implementation:
- Calculate prediction distribution statistics weekly (mean, std dev, percentiles)
- Compare against training period baseline
- Investigate when 25th percentile prediction drops significantly (model becoming less confident)
- Monitor for prediction values outside training range
Example: A price optimization model trained on laptops priced $500-$3,000 is now trying to price laptop bundles priced $1,500-$8,000. The prediction distribution shifts dramatically-the model is outside its training distribution.
Error Analysis and Segmentation
Dig deeper into how your model fails. Implementation:
- Weekly review of highest-error predictions
- Segment errors by feature value ranges
- Identify whether errors concentrate in specific scenarios
- Compare error patterns to previous periods
Example: A fraud detection model detecting increased false negatives specifically for transactions involving new merchants suggests fraudsters have changed their tactics to include merchants the model wasn’t trained on.
Set thresholds that balance business risk, retraining cost, and false alarms
Published thresholds (e.g., PSI > 0.25, accuracy drop > 2%) are starting points, not universal rules. Threshold design must account for:
- Baseline variation: What is the normal noise range for this metric in this system? Thresholds must be set above the noise floor or false alarms will dominate.
- Business risk of missed drift: In high-stakes systems (medical, financial, safety-critical), the cost of a missed degradation is asymmetrically high — tighten thresholds.
- Retraining cost and deployment risk: Frequent retraining introduces deployment risk. Models with complex governance or long validation cycles warrant wider alert windows.
- False-positive cost: A team that responds to every yellow alert with a retraining attempt will develop alert fatigue and stop responding to genuine signals.
- Trend thresholds: Alert on rate of change as well as absolute level. A metric declining 0.5% per week for four consecutive weeks is a different signal than a single 2% drop — even if the absolute magnitude is similar.
Drift response decision framework: monitor, investigate, retrain, redesign, or rollback
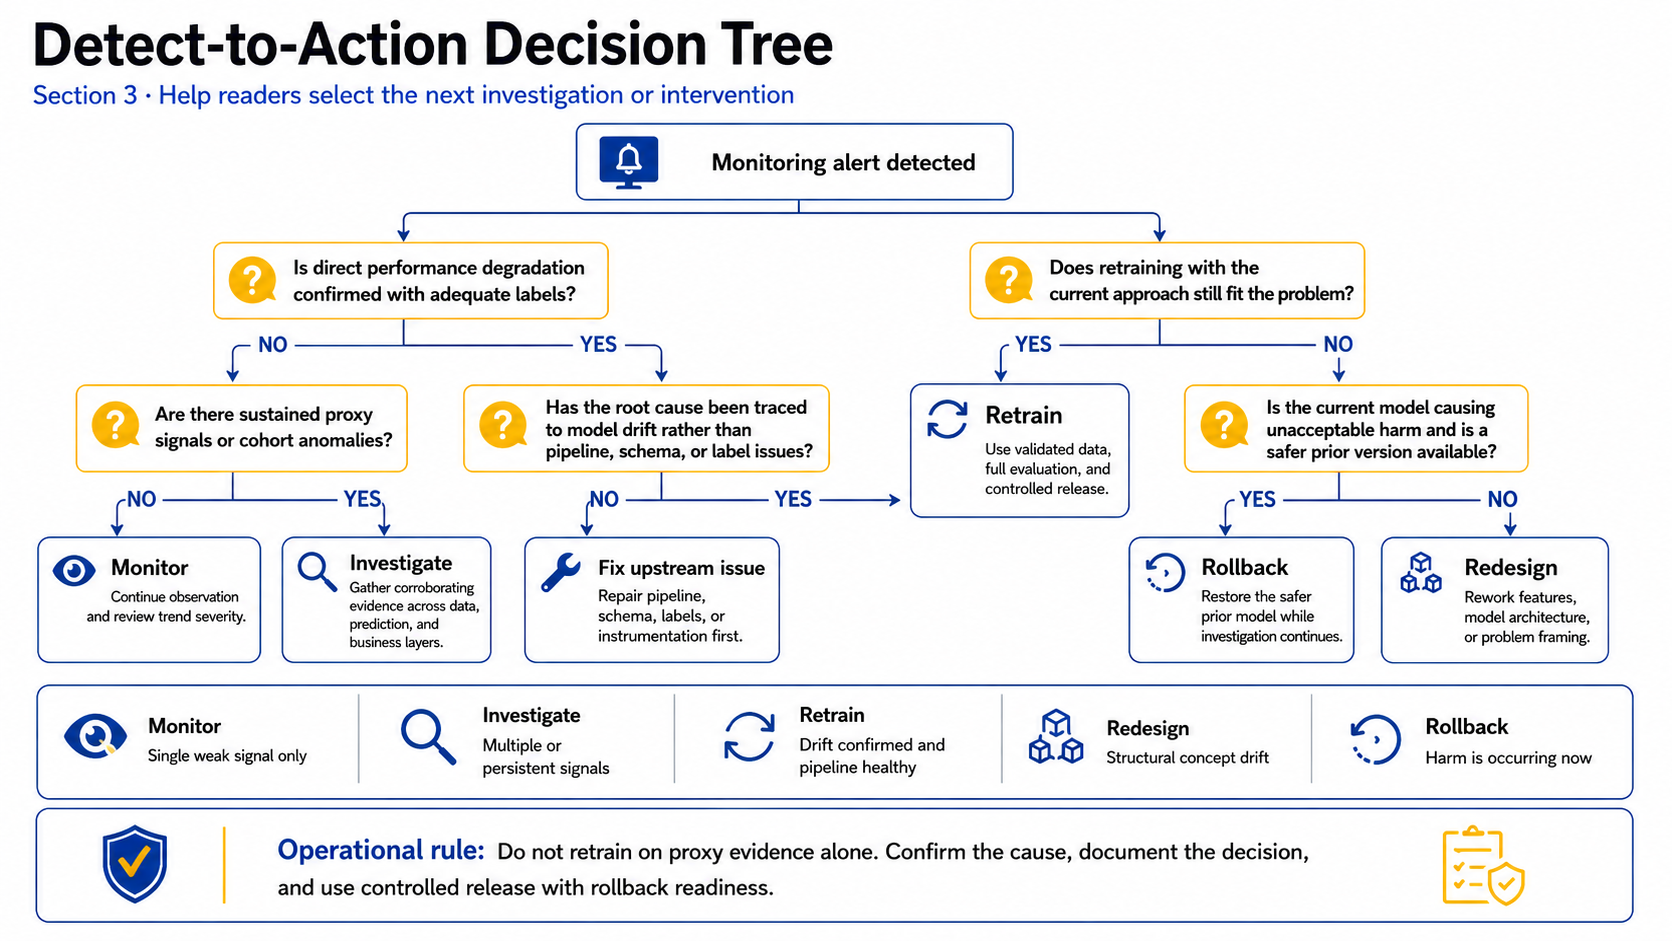
This framework provides the operational decision path after a drift signal has been confirmed.
Entry criterion: A monitoring signal has been classified as Yellow, Orange, or Red severity.
| Response | When to use it | Entry criteria | Exit criteria |
|---|---|---|---|
| Monitor | The signal remains within the Yellow severity range, with no corroborating evidence | A single proxy signal is detected, but no model-performance degradation is confirmed | The signal returns to normal, or additional evidence emerges within the defined monitoring window |
| Investigate | Multiple signals are present, or the issue reaches Orange severity | Corroborating signals are detected across two or more monitoring layers | The root cause is identified and the next response is selected |
| Retrain | Performance degradation is confirmed and the root cause is model drift rather than a pipeline failure | Direct performance evidence is available, data or concept drift is confirmed, and the production pipeline is healthy | The candidate model passes evaluation and is safely released to production |
| Redesign | Concept drift is structural, meaning retraining with the existing data and approach will not resolve the problem | Retraining fails evaluation, or investigation confirms that the underlying task or real-world relationship has fundamentally changed | A new feature set, model architecture, or problem framing is validated |
| Rollback | The current production model is causing harm and a safer or better-performing previous version is available | Red severity is reached, an incident is declared, and harm is confirmed or the level of risk is unacceptable | The previous model version is restored while root-cause investigation continues |
Operational rules:
- Do not retrain when root cause is a pipeline failure, schema change, or labelling defect — fix the upstream issue first.
- Do not rollback without verifying that the prior model is not subject to the same failure mode.
- Every response action must be documented in the incident log.\
How to investigate drift when labels arrive late?
Label delay creates a gap between when a prediction is made and when its accuracy can be measured. Teams cannot wait for ground truth before responding to proxy signals.
Structured response to label delay:
- Maintain leading indicators. Monitor input and prediction distributions continuously. These are available immediately after each prediction batch.
- Define a label SLA. Know the typical label arrival window for your system. Build your evaluation pipeline to account for this delay explicitly — do not conflate “no labels yet” with “model is performing well.”
- Use proxy metrics as interim evidence. Treat sustained PSI breach or prediction distribution shift as a prompt to pre-stage investigation, not as a trigger for immediate retraining.
- Run incremental evaluation as labels arrive. Do not wait for a full batch. Evaluate on partial label sets and update the evidence base as ground truth becomes available.
- Prevent feedback-loop bias. If model outputs influence which outcomes get labelled (e.g., a model that rejects loan applications means rejected applications have no outcome data), track this gap. Training exclusively on model-approved cases introduces selection bias into future retraining.
Label-delay response timeline: Proxy signals fire at T+0. Partial labels arrive at T+N days. Full evaluation possible at T+M days. Response decision should be staged — not held until T+M if risk is high.
4. Decide When and How to Retrain
Scheduled, trigger-based, and hybrid retraining: when each approach fits
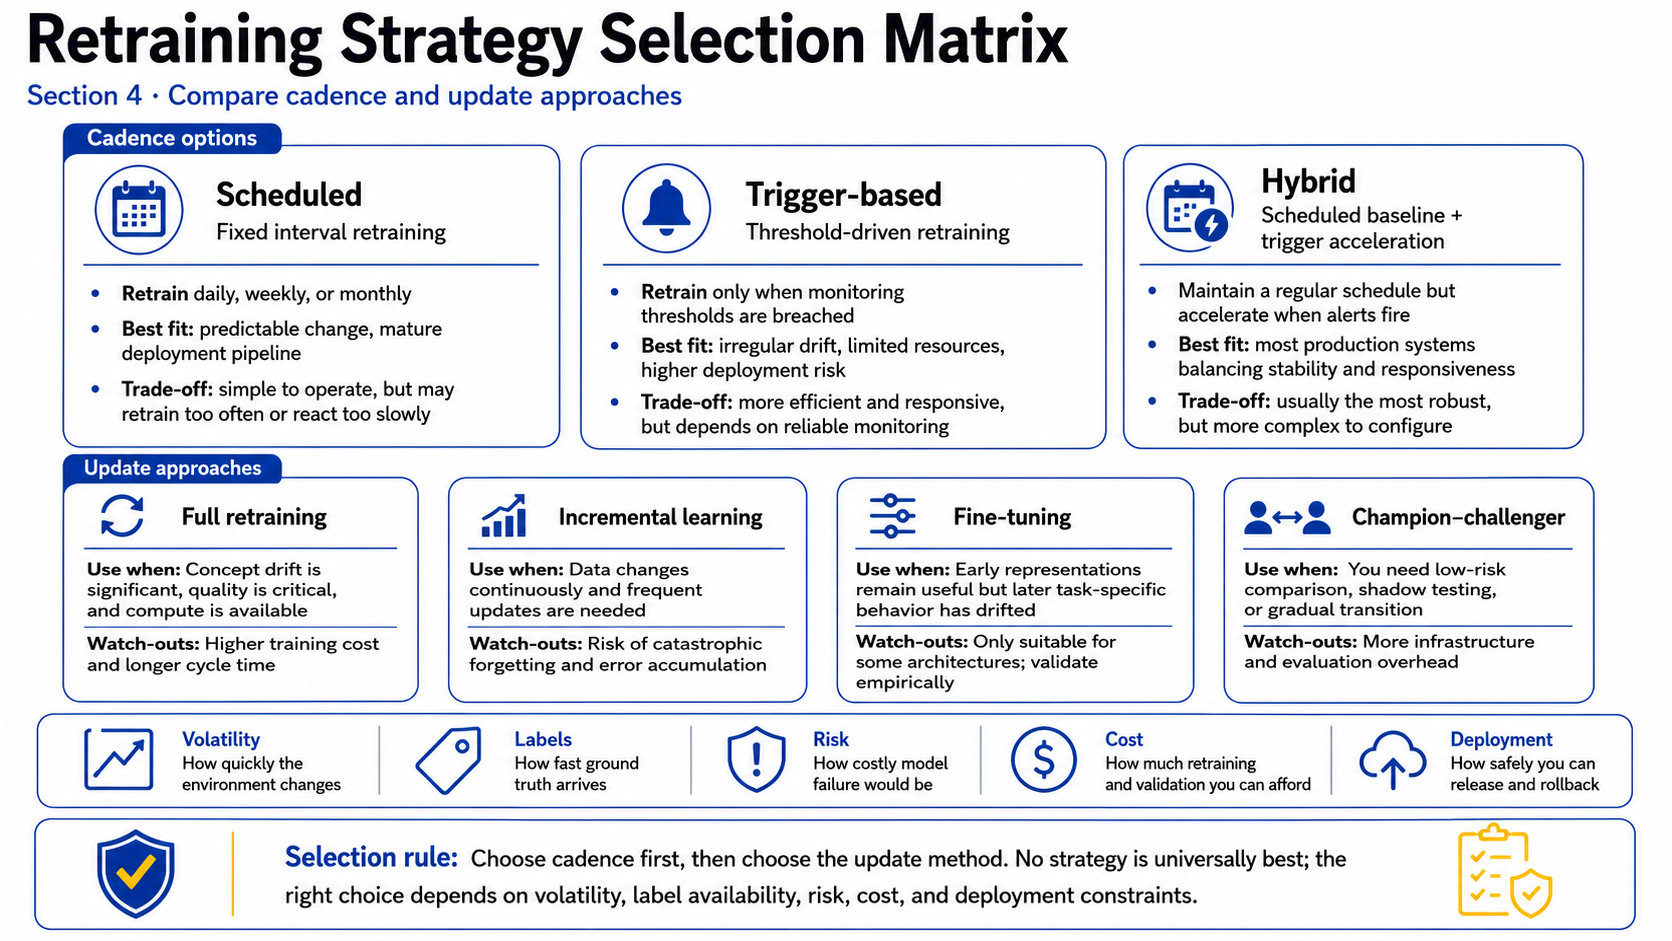
The retraining cadence decision is separate from the model-update method decision. Answer “when?” first, then answer “how?”.
| Cadence | Description | Best fit | Trade-offs |
|---|---|---|---|
| Scheduled | Retrain the model at a fixed interval, such as daily, weekly, or monthly | Systems where data changes predictably, sufficient computing resources are available, and deployment infrastructure is mature | Simple to operate, but may trigger unnecessary retraining and can respond too slowly to sudden drift |
| Trigger-based | Retrain the model only when a predefined monitoring threshold is breached | Systems with unpredictable drift, limited resources, or high deployment risk | More efficient and responsive to sudden drift, but depends on robust monitoring and may be affected by false triggers |
| Hybrid | Use a fixed retraining schedule as the baseline, with accelerated retraining when a threshold is breached | Most production systems that need both operational stability and responsiveness | More complex to configure, but generally the most robust approach in practice |
Avoid declaring hybrid universally best. The correct choice depends on volatility, label availability, compute budget, and deployment risk in your specific environment.
Choose the right model-update method
Once retraining is authorised, select the update method based on the failure mode, available data, and operational constraints.
Full retraining
Rebuild the model from scratch using a defined historical data window plus recent data.
When appropriate: Significant concept drift requiring fundamental model changes; infrequent retraining cycles (monthly or less); compute resources available; model quality is critical.
Key considerations:
- Define a data window that balances recency with historical coverage. A 12-month window with recent data weighted more heavily is a common starting point — appropriate window length depends on how quickly your domain changes.
- Apply identical preprocessing and feature engineering as the original pipeline to ensure reproducibility.
- Do not deploy based on training metrics alone. Full evaluation against held-out validation data is required.
- Account for computational cost and training time in your retraining schedule design.
Incremental learning
Update the existing model using only recent data, without resetting parameters.
When appropriate: High-frequency retraining requirements (daily or more); resource-constrained environments; gradual and continuous data change; streaming data scenarios.
Key risks to manage:
- Catastrophic forgetting: The model overwrites learned patterns with recent data. Mitigate by mixing recent data with a representative sample of historical data, and by scheduling periodic full retraining checkpoints (every 4–8 weeks is a common practice).
- Error accumulation: Small biases introduced in each incremental update compound over time. Monitor long-term trend metrics, not just short-term performance.
- Use regularisation (L1/L2) and reduced learning rates relative to initial training.
Fine-tuning and selective updates
Freeze early model layers (which have learned general patterns) and retrain later layers on recent data.
When appropriate: Deep neural networks where early-layer representations remain valid but task-specific layers have drifted. Suitability depends on model architecture and must be validated empirically — do not assume fine-tuning is appropriate without architecture review.
Ensemble and champion-challenger strategies
Maintain two or more models with different training windows; blend or select predictions based on recency weighting or performance comparison.
When appropriate: Risk-sensitive deployments where abrupt model transitions are undesirable; A/B testing of candidate models; gradual retirement of older models.
Implementation: Shadow testing validates the challenger without customer exposure. Canary deployment exposes the challenger to a controlled traffic fraction before full rollout. Weight the champion and challenger based on validated performance, not assumptions.
Retraining decision matrix: volatility, labels, risk, cost, and deployment constraints
Use this matrix as a decision aid, not a policy. Select the row that best describes your system’s dominant operating condition.
| System condition | Recommended cadence | Recommended method | Notes |
|---|---|---|---|
| High volatility, labels available quickly, low deployment risk | Trigger-based or daily scheduled retraining | Incremental retraining or full retraining using a short data window | Prioritise responsiveness |
| High volatility, labels delayed | Trigger-based retraining using proxy metrics, combined with frequent full retraining | Full retraining when ground-truth labels become available | Use proxy signals to prepare the retraining process, then validate the decision once labels arrive |
| Low volatility, labels available | Monthly scheduled retraining | Full retraining using a wide data window | Prioritise stability over responsiveness |
| High risk: regulated or safety-critical | Trigger-based retraining with strict thresholds and mandatory human approval | Full retraining with a complete evaluation and validation pipeline | Do not deploy the model automatically without human sign-off |
| Resource-constrained | Weekly or monthly scheduled retraining | Incremental retraining with periodic full resets | Balance retraining frequency against available budget and evaluation coverage |
| Concept drift confirmed | Trigger-based response | Redesign the features or model architecture before retraining | Retraining on the existing feature set will not resolve structural concept drift |
5. Build a Safe Automated Retraining Lifecycle
Automation reduces response latency and removes manual error from retraining pipelines — but it does not eliminate the need for validation gates, monitoring, and rollback controls. Every automated pipeline must include explicit checkpoints.
Stage 1: Validate and prepare retraining data
Checklist before training begins:
Schema validated against expected contract (field names, types, null constraints)
Null rates within acceptable thresholds for all required features
Range and categorical-value distribution checks passed
Outlier detection run; anomalous records flagged or removed
Point-in-time feature availability confirmed — no features use information unavailable at prediction time
Preprocessing and feature engineering applied from the same pipeline version as the original model
Data window defined and documented (start date, end date, weighting strategy)
Training/validation/test split defined (time-based split preferred for time-series data)
Data leakage audit completed
Stage 2: Train, version, and document candidate models
Every training run is only deployable if it is reproducible and fully documented.
| Field | What to record |
|---|---|
| Model version | Semantic version number or unique training-run identifier |
| Training date | Date and time when model training was completed |
| Training data window | Start and end dates of the data used for training |
| Features | Complete feature list, including feature versions |
| Algorithm and hyperparameters | Full model configuration linked to the relevant code commit |
| Code version | Git commit hash or equivalent version identifier |
| Library versions | Python version, framework version, and versions of key dependencies |
| Training environment | Hardware, operating system, container, and infrastructure details |
| Training metrics | Training loss curve, convergence status, and other relevant optimisation metrics |
A training run that does not have this metadata cannot be reproduced, cannot be debugged during an incident, and should not be considered for deployment.
Stage 3: Evaluate performance, fairness, robustness, and leakage risk
Pre-deployment evaluation scorecard:
| Check | Requirement | Fail action |
|---|---|---|
| Task performance | Meets or exceeds the production model’s performance on a held-out validation set | Do not deploy; investigate the training data, feature pipeline, or model configuration |
| Segment performance | Shows no material degradation compared with the production model across any monitored cohort | Do not deploy; investigate the affected cohort and identify the source of the performance gap |
| Calibration | Predicted probabilities align with observed outcome rates | Recalibrate the model and investigate the cause of calibration degradation |
| Fairness, where applicable | Fairness metrics, such as demographic parity and equal opportunity, are not degraded compared with the production model | Do not deploy; escalate the candidate model for responsible AI review |
| Robustness | Performance remains stable under reasonable input perturbations | Investigate feature sensitivity and improve model robustness before deployment |
| Data leakage | No feature uses information that would be unavailable at prediction time | Remove the leaking features and retrain the model |
| Regression | Holdout test sets from the original training period continue to pass | Investigate potential catastrophic forgetting or regression in previously learned patterns |
Human review is required when: automated checks fail; new features are introduced; training dataset size changes materially; training process takes significantly longer than baseline; the model is used in a regulated or high-stakes domain.
*Source: evaluation standards consistent with ML model risk management frameworks (US OCC SR 11-7 equivalent principles).
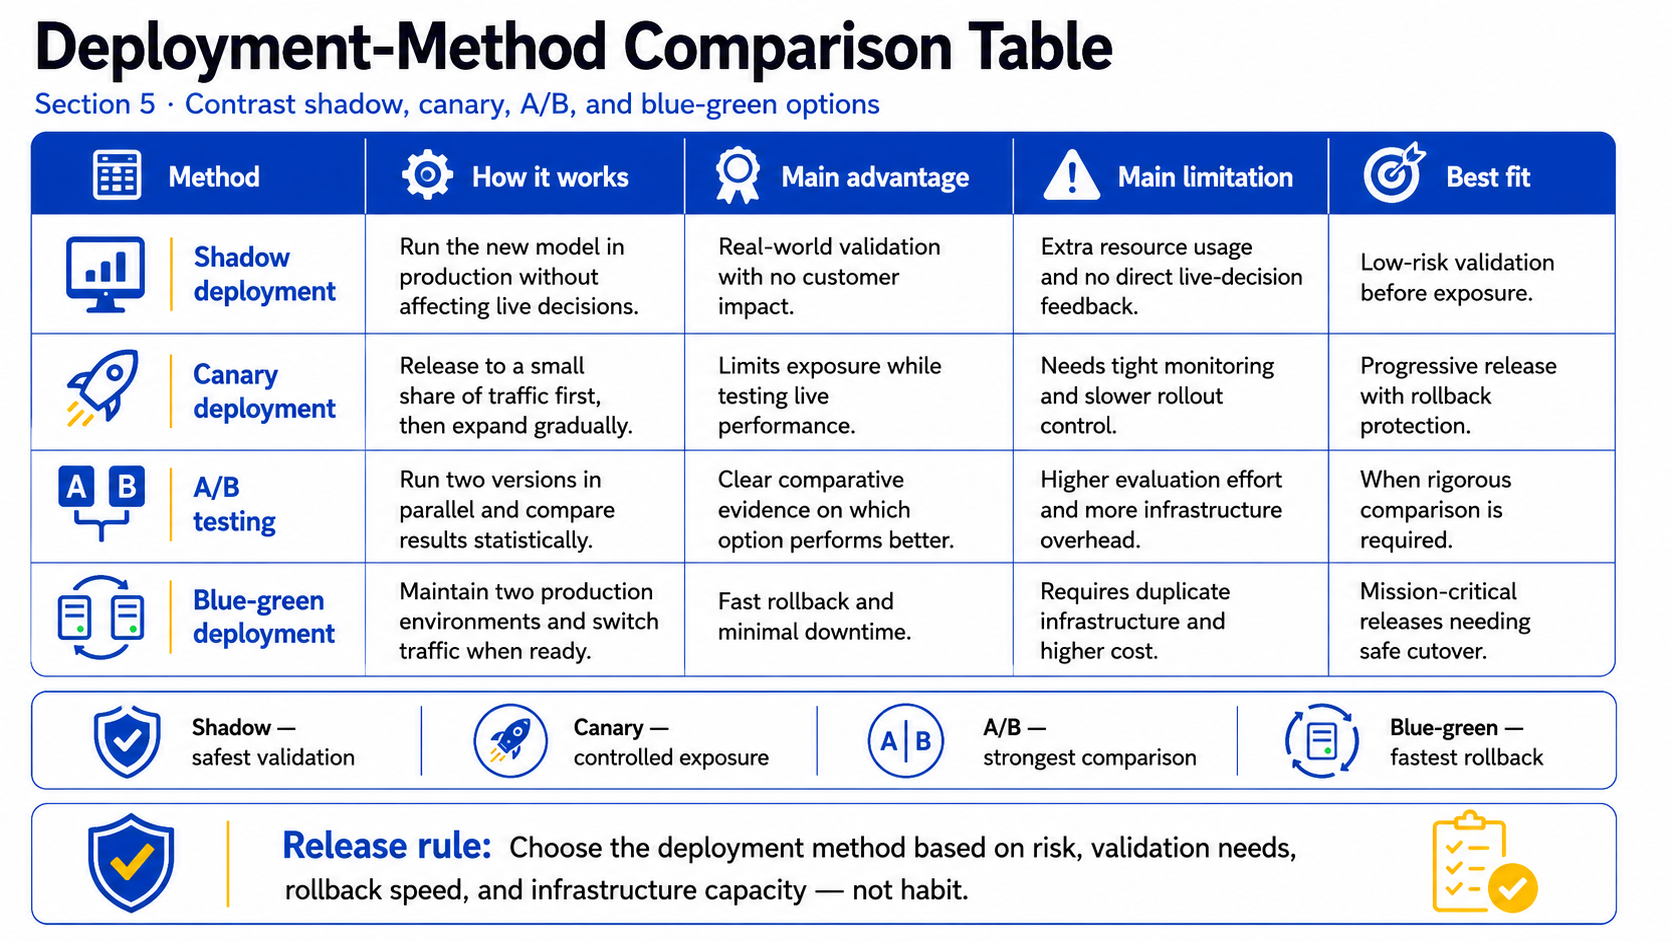
Stage 4: Release safely with shadow, canary, A/B, or blue-green deployment
Option 1: Shadow Deployment
- Run new model in production but don’t use predictions
- Capture predictions for offline comparison
- Deploy if performance looks good
Pros: Real-world validation without customer impact
Cons: Double resource consumption, no real-world feedback on decisions
Option 2: Canary Deployment
- Deploy new model to small % of traffic initially (e.g., 5%)
- Monitor canary performance vs. current model
- Gradually increase traffic if metrics look good (5% → 20% → 50% → 100%)
- Automatic rollback if metrics degrade
Pros: Limited exposure to issues, real-world validation
Cons: Complex monitoring, slower rollout
Option 3: A/B Testing
- Run new model in parallel with current model for percentage of traffic
- Statistically compare performance
- Deploy whichever performs better
Pros: Rigorous comparison, clear winner
Cons: Double resource consumption, slower decision
Option 4: Blue-Green Deployment
- Maintain two identical production environments (blue and green)
- Deploy new model to inactive environment (green)
- After thorough testing, switch traffic to green
- Keep blue as instant rollback
Pros: Zero downtime, quick rollback
Cons: Requires duplicate infrastructure, higher cost
Stage 5: Monitor the release, define rollback criteria, and close the feedback loop
Post-Release Monitoring Runbook:
| Element | Specification |
|---|---|
| Observation window | Monitor the release for at least 24–72 hours. Use a longer window for low-traffic systems or systems with delayed feedback and label arrival. |
| Owner | Assign a named ML engineer who is accountable for monitoring the release and coordinating the response to any anomalies. |
| Metrics to watch | Monitor all four layers: direct model performance, input and feature distributions, prediction distribution and calibration, and cohort or business outcomes. Compare results with the champion model’s baseline. |
| Rollback trigger | Roll back if any Red-severity alert occurs during the observation window or if model performance falls below the defined minimum threshold. |
| Rollback procedure | Revert to the previous model version through the model registry, confirm that production traffic has been restored to the prior version, and record the event as an incident. |
| Documentation | Record the release date, model version, metrics at release, detected anomalies, actions taken, and the final outcome of the observation window. |
| Feedback loop | After the model reaches a stable operating period, update monitoring baselines using the new model’s metrics and carry forward any threshold adjustments identified during the release. |
Close the loop: Post-release observations should update the team’s threshold configuration and incident playbooks. Each release cycle is an opportunity to improve future detection accuracy — not just to validate the current candidate.
End-to-end example: a drift-triggered retraining workflow
This example is illustrative. Specific performance figures are not claimed as real outcomes.
A transaction-risk model raises a warning because prediction scores shift for newly onboarded merchants.
- MLOps validates schemas, feature freshness, pipeline execution, and model version.
- Data science identifies that the change is concentrated in one merchant cohort.
- Risk operations manually reviews a sample of high-impact decisions.
- Delayed outcomes confirm increased false negatives in the affected cohort.
- The team determines that the existing features remain valid but recent attack patterns are underrepresented.
- A full retraining run uses a versioned dataset containing historical and recent confirmed cases.
- The candidate is evaluated on overall performance, affected cohorts, calibration, false-positive workload, and temporal holdout data.
- The candidate runs in shadow mode before receiving limited canary traffic.
- Rollout continues only if model and operational thresholds remain within approved limits.
- The incident record, monitoring rules, model registry, and runbook are updated.
The lesson is not that every incident requires this exact sequence. The lesson is that retraining is one controlled stage within a broader investigation and release process.
6. Avoid Retraining Failures and Data Pitfalls
Retraining introduces its own risks. A poorly designed retraining process can produce a new model that is less reliable than the one it replaced.
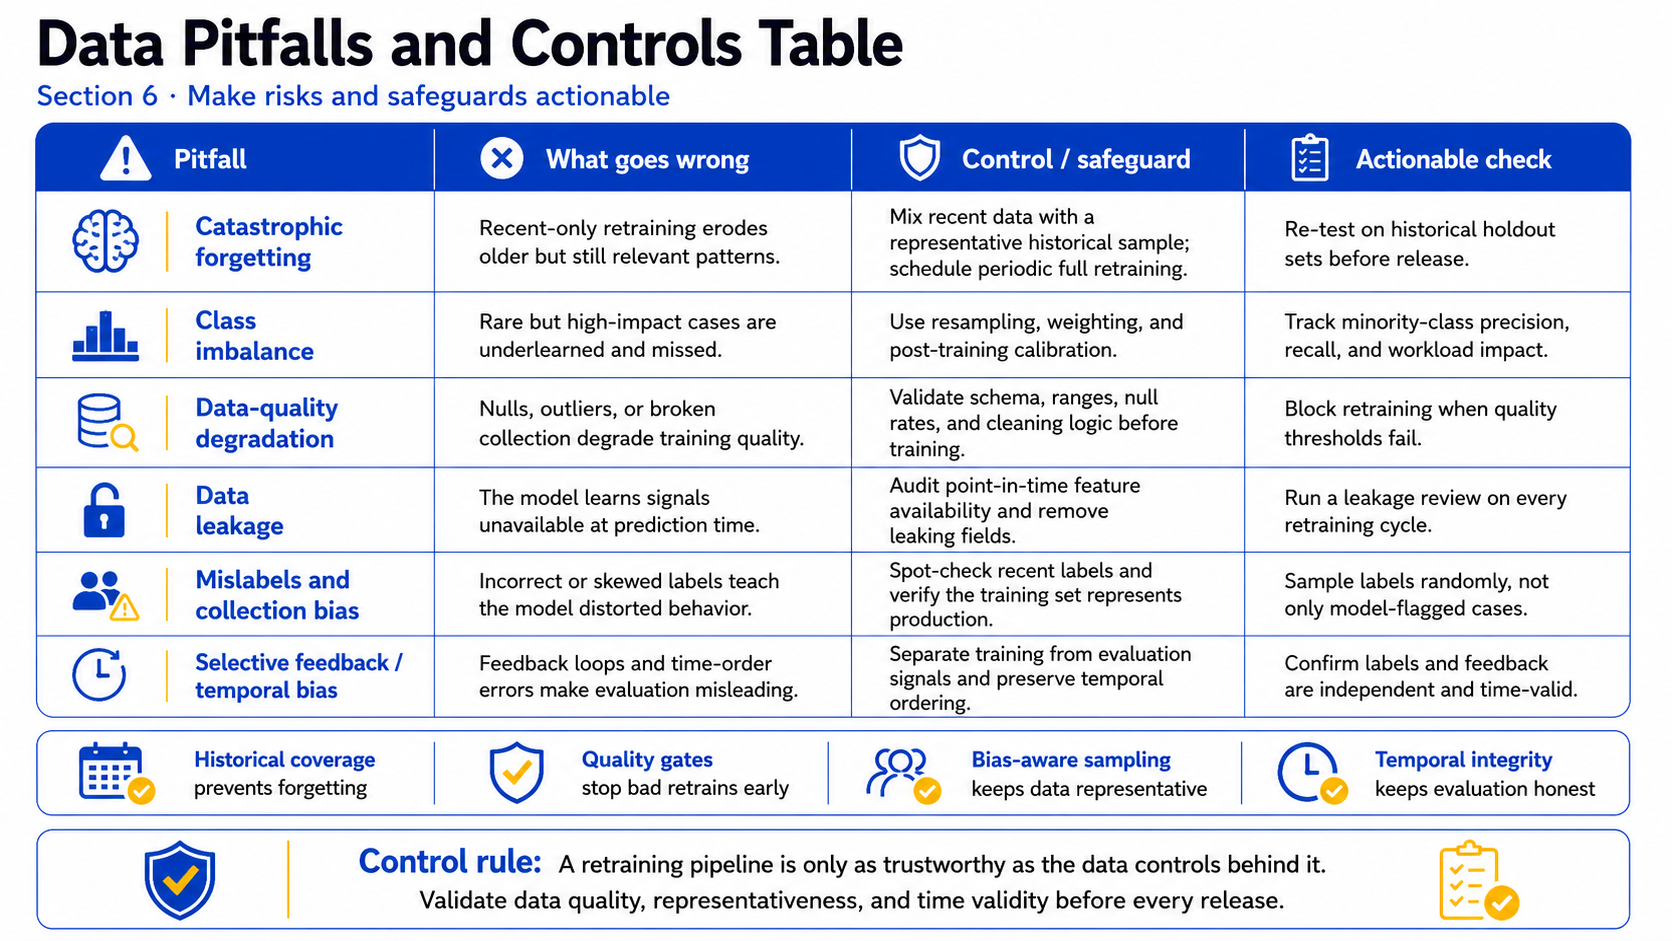
Select recent and historical data without causing catastrophic forgetting
The optimal data window depends on how quickly your domain changes. There is no universal prescription.
| Domain change rate | Typical data-window approach |
|---|---|
| Rapid — for example, real-time bidding or trending-content systems | Use the most recent 30–90 days of data, with strong weighting toward newer observations |
| Moderate — for example, e-commerce or churn-prediction systems | Use 6–18 months of data, with moderate weighting toward more recent observations |
| Slow — for example, credit-risk or industrial-equipment systems | Use 2–5 years of data, generally treating historical and recent observations equally |
Catastrophic forgetting mitigation: Never train exclusively on the most recent data for a periodic model. Mix a representative historical sample with recent data. Set the mix ratio based on the domain volatility assessment above, and validate that the retrained model maintains performance on historical test sets.
Handle class imbalance, data-quality degradation, and data leakage
Data-risk checklist:
Class imbalance: Training class distribution matches production class distribution (or imbalance is handled explicitly via resampling + calibration)
Data-quality degradation: Null rates, range violations, and outlier rates validated before training; same cleaning logic as original pipeline applied
Data leakage: All features confirmed available at prediction time; no features derived from target variable; no future data in feature windows
Mislabelled data: Spot-check a sample of recent labels before training, especially if labelling process or team has changed
Collection bias: Confirm that training data represents the production distribution — not just the outcomes visible to the model (e.g., for a lending model, approved loans only)
Distinguish model performance issues from data collection and labelling defects. A model trained on degraded data will learn degraded patterns — resolving the data quality issue is the prerequisite for a successful retrain.
Use delayed labels, human review, and feedback loops responsibly
Feedback loop safeguards:
- Selective labelling: Do not label only the cases where the model was most confident. This introduces survivorship bias and trains future models to be overconfident.
- Human review: Use domain expert review on a random sample — not just on model-flagged cases — to maintain label quality.
- Bias checks: Audit whether labelled cases are representative of the full production distribution. Systematic gaps (e.g., a fraud model where only flagged transactions are investigated) must be accounted for in training.
- Separation of training and evaluation signals: Never use the same feedback signal for both training and evaluating the same model version. Evaluation must be on independent data.
- Temporal integrity: Ensure feedback labels respect temporal ordering. A label collected after the model’s output should not be used to evaluate predictions made before that label was possible to generate.
7. Govern Model Maintenance as an Ongoing Operating Practice
Technical excellence isn’t sufficient for long-term AI system upkeep. You also need governance frameworks to ensure responsible, sustainable model management.
Governance Component 1: Model Registry and Versioning
Every model should be versioned and tracked:
Minimum information:
- Model version identifier (v1.0, v1.1, v2.0)
- Training date and data period
- Performance metrics (accuracy, F1, AUC, etc.)
- Features used
- Algorithm and hyperparameters
- Training code version (Git commit hash)
- Training environment (Python version, library versions)
- Deployed date and production performance
Tools:
- MLflow Model Registry
- Hugging Face Model Hub (for NLP models)
- Cloud-native registries (AWS SageMaker, Google Vertex AI)
Governance Component 2: Approval gates, accountability, and change management
No model reaches production without explicit approval. The accountability matrix below is illustrative — adapt role titles and structure to your organisation’s size and governance model.
1. Retraining Initiation
- Accountable role: ML engineer or model owner
- Consulted role: Data engineer
- Approval criteria: Drift has been confirmed, and the root cause is not a pipeline failure.
2. Candidate Model Evaluation
- Accountable role: ML engineer
- Consulted role: QA or test engineer
- Approval criteria: The candidate model has passed all Stage 3 evaluation checks.
3. Deployment Approval
- Accountable role: Tech lead or ML platform owner
- Consulted role: Risk or compliance team for regulated models
- Approval criteria:
- Evaluation scorecard is complete
- Release strategy is defined
- Rollback plan is documented
4. Post-Release Sign-Off
- Accountable role: Model owner
- Consulted role: Monitoring team
- Approval criteria: The observation window is complete, and no rollback has been triggered.
5. Governance Review
- Accountable role: Head of AI or risk
- Consulted roles: All roles involved in model development, evaluation, deployment, and monitoring
- Approval criteria: All production models are reviewed quarterly against defined maintenance and governance standards.
Change management rule: Any change to features, algorithm, or training data window is a material model change and requires documentation and approval equivalent to a new model release.
Governance Component 3: Incident response and model-drift runbooks
Integrate with the five-action response framework from Section 3 rather than creating a parallel process. Model-drift incident workflow:
- Alert received → classify severity (Yellow / Orange / Red)
- First responder (ML engineer) → run first-response diagnostic checklist (Section 1)
- Root cause identified → pipeline failure → fix pipeline; OR drift confirmed → proceed to response framework
- Response selected → monitor / investigate / retrain / redesign / rollback
- Containment → if Red severity, consider rollback to prior model while investigation continues
- Recovery → new model deployed (if retraining path) OR prior model confirmed stable (if rollback path)
- Post-incident review → document root cause, resolution, prevention action, and threshold adjustment
- Learning shared → update runbooks; adjust monitoring configuration; brief team
A practical model-maintenance checklist for ML teams
Use this checklist as an operational reference — not an unprioritised task dump. Complete each category on the indicated cadence.
Monitoring (daily):
Performance metrics calculated and compared to baseline
Feature distribution metrics (PSI, KS) computed and reviewed
Prediction distribution monitored; anomalies flagged
Data-quality metrics validated for each incoming batch
Monitoring (weekly):
Segment-level error analysis completed
Business outcome metrics reviewed (conversion, fraud loss, etc.)
Alert trend review: are thresholds still correctly calibrated?
Decision thresholds (per-model, reviewed quarterly):
Thresholds documented with rationale for each model
Thresholds account for baseline noise, business risk, and retraining cost
Trend thresholds configured (not just absolute level alerts)
Data and evaluation (per retraining cycle):
Data window and weighting strategy documented
Pre-training data checklist completed (schema, nulls, leakage, quality)
Evaluation scorecard completed before deployment
Historical regression test passed
Release and rollback (per release):
Deployment method selected and documented
Rollback criteria defined before deployment begins
Observation window completed post-release
Release outcome logged in model registry
Governance (quarterly):
All production models have complete lineage records
Approval records current and complete
Incident log reviewed; learnings applied to runbooks
Model cards current and accurate
Threshold and cadence configuration reviewed against recent performance
FAQ: AI Model Drift and Retraining
What is the difference between data drift and concept drift?
Data drift (covariate shift) means the statistical distribution of input features has changed relative to training data. The model is receiving different-looking inputs than it was trained on — but the underlying relationship between those inputs and the target may be unchanged.
Concept drift means the relationship between input features and the target variable has changed. The inputs may look similar to training data, but the correct prediction for a given input is now different from what the model learned.
How do you know when a model should be retrained?
The decision should follow an evidence-based process, not a fixed threshold or universal schedule. Retrain when all of the following are true:
- A performance metric has declined beyond your documented alert threshold (not just a proxy signal).
- The root cause has been investigated and confirmed as model drift — not a pipeline failure, schema change, or measurement issue.
- The retraining data is available, clean, and representative of the current production distribution.
- The retraining will be followed by full evaluation and a controlled release with rollback criteria.
Can Data Drift Occur Without Model-Performance Degradation?
Yes. Input distributions may change in features the model rarely uses, within regions where predictions remain stable, or because of an expected business event.
Investigate feature importance, model sensitivity, prediction behavior, calibration, cohorts, and eventual outcomes before deciding that retraining is necessary.
Is Scheduled Retraining Better Than Trigger-Based Retraining?
Neither is universally better.
Scheduled retraining fits predictable change and regular label availability. Trigger-based retraining fits irregular change when monitoring evidence is reliable. A hybrid approach can provide both a maximum review interval and faster response, but it adds complexity.
What Should Be Checked Before Deploying a Retrained Model?
Check training data quality, point-in-time availability, leakage, reproducibility, task performance, calibration, cohort results, fairness where applicable, robustness, operational performance, downstream compatibility, documentation, approval, deployment strategy, monitoring, and rollback readiness.
Conclusion
Production ML maintenance is an ongoing operational capability, not a periodic retraining task. The lifecycle — detect, triage, decide, retrain, validate, release, govern — must be designed before it is needed, not assembled in response to a monitoring alert.
Strong ML teams monitor several signal types, diagnose the cause before changing the model, choose proportionate interventions, validate every candidate, release through controlled stages, and preserve the evidence needed for accountability and rollback.
The best response to drift is not always faster retraining. It is the least risky action supported by the available evidence.
Next Steps: Assess Your Model-Monitoring and Retraining Readiness
If your production ML systems lack complete monitoring across all four layers, documented retraining decision criteria, or governed release and rollback processes, the framework in this guide provides a starting structure.
A practical starting point: audit your highest-impact production model against the maintenance checklist in Section 7. Identify which categories have gaps. Address monitoring and baseline documentation before building retraining automation — you cannot make trustworthy retraining decisions without the monitoring foundation in place.
SmartDev’s MLOps, AI development, data engineering, and AI consulting teams support organisations in building and operating production ML maintenance systems. Whether you are establishing monitoring from scratch or maturing an existing MLOps capability, we can help design the monitoring architecture, retraining pipelines, evaluation frameworks, and governance structures appropriate to your deployment context and risk profile.

References
- IBM Think: Model Drift
- Domino Data Science Dictionary: Model Drift
- Datadog: Machine Learning Monitoring
- AI Governance framework context: EU AI Act
- Model risk management principles: US OCC SR 11-7
- Iguzio: Drift Monitoring
All platform capability claims should be verified against current vendor documentation before implementation decisions are made. Performance figures cited in illustrative examples are not asserted as real outcomes.