

TL;DR:
- AI in Power BI helps users analyze data faster through natural-language queries, automated insights, forecasting, anomaly detection, and AI-assisted report creation.
- Features such as Copilot, Key Influencers, Decomposition Tree, Smart Narratives, and AI visuals make advanced analytics more accessible to non-technical users.
- Practical applications include sales forecasting, customer segmentation, financial analysis, operational monitoring, supply chain optimization, and executive reporting.
- Successful implementation depends on clean data, well-designed semantic models, appropriate governance, and clearly defined business use cases.
- AI should support—not replace—human judgment, particularly when interpreting complex trends, validating recommendations, and making high-impact decisions.
1. Introduction
Data visualization and reporting create real value only when they lead to meaningful insights and better decisions. As Microsoft’s flagship business intelligence platform, Power BI helps organizations turn complex, fragmented data into clear and actionable business intelligence.
The integration of artificial intelligence is extending these capabilities further. With features such as predictive analytics, automated insights, anomaly detection, and natural language queries, Power BI enables users to identify patterns faster, explore data more intuitively, and make more informed decisions.
This guide examines practical AI applications in Power BI and explains how organizations can use them to accelerate analysis, uncover hidden opportunities, and improve business outcomes.
For a broader view of how AI is delivering measurable impact beyond business intelligence platforms, explore our AI use cases hub, featuring more than 500 real-world implementations across industries including finance, manufacturing, healthcare, and logistics.
2. What AI Means in Power BI Today?
Artificial intelligence in Power BI refers to a collection of capabilities that help users explore data, identify patterns, generate explanations and build analytical content more efficiently. Rather than functioning as one standalone AI system, Power BI combines several types of intelligence across data preparation, semantic modelling, visualization and report consumption.
These capabilities range from established analytical features, such as forecasting and anomaly detection, to generative AI experiences powered by Copilot. Power BI can also connect with Microsoft Azure services and external machine-learning models when organizations require more specialized predictive or cognitive capabilities.
The Power BI AI Capability Landscape
The AI capabilities available in Power BI can be grouped into three main categories.
AI Visuals and Automated Insight Features
Power BI includes visuals and analytical features designed to help users discover patterns without manually testing every possible relationship in a dataset.
The Key Influencers visual analyzes the factors associated with a selected outcome and ranks those with the strongest influence. For example, a business could use it to examine which customer, product or service characteristics are most closely associated with churn.
The Decomposition Tree allows users to break a metric down across multiple dimensions and explore the contributors behind a result. It is particularly useful for investigating questions such as why revenue declined, which regions contributed most to rising costs or where operational delays originated.
Other AI-supported capabilities include anomaly detection, forecasting, clustering, Smart Narratives and Quick Insights. Together, these features can help users identify unusual changes, explore possible drivers and communicate findings more clearly. Microsoft classifies these capabilities broadly as visual-level AI features within Power BI.
These tools accelerate exploratory analysis, but they do not automatically establish causation. An identified relationship may indicate correlation rather than prove that one factor directly caused another.
Copilot-Assisted Analytics and Report Experiences
Copilot brings generative AI into the Power BI authoring and report-consumption experience. Users can interact with report data through conversational prompts, request summaries, explore business questions and receive assistance with analytical tasks.
Depending on the available experience and permissions, Copilot can help users:
- Summarize reports and highlight important findings.
- Ask natural-language questions about data.
- Generate or edit report content.
- Suggest report pages and visual structures.
- Explain selected metrics or trends.
- Assist creators with Data Analysis Expressions, or DAX.
- Help users explore semantic models more efficiently.
Copilot can therefore reduce the time required to move from an initial business question to a usable analysis. Microsoft positions it as a chat-based experience supporting activities ranging from ad hoc business analysis to DAX generation for report creators. However, Copilot availability depends on organizational settings, capacity, licensing and regional support. Microsoft currently requires access to an eligible paid Fabric or Power BI Premium capacity, and administrators must enable the feature before users can access it.
Copilot should also not be confused with the traditional Power BI Q&A visual. While both allow natural-language interaction, Microsoft has announced that the Q&A visual is scheduled for deprecation in December 2026, making Copilot increasingly central to conversational analytics in Power BI.
AI Insights, Cognitive Services and Machine-Learning Integrations
Power BI can also enrich data by applying AI and machine-learning functions during data preparation or through integrations with the wider Microsoft ecosystem.
Depending on the environment, architecture and licensing model, organizations may use capabilities such as:
- Text sentiment analysis.
- Language detection.
- Key-phrase extraction.
- Image tagging.
- Automated machine learning.
- Azure Machine Learning models.
- R and Python transformations or visuals.
- Custom model outputs imported from external platforms.
These capabilities allow Power BI to work with more than conventional numerical and categorical data. For example, an organization could analyze customer feedback by sentiment, classify support messages by topic or display predictions generated by a machine-learning model alongside operational KPIs.
Microsoft groups AutoML, Azure Machine Learning, Cognitive Services and R or Python transformations under AI enrichment capabilities. Some advanced functions require Premium Per User or Premium/Fabric capacity, and availability may vary according to the specific Power BI or Fabric configuration.
For more advanced implementations, Power BI often serves as the reporting and decision-support layer rather than the platform where the entire AI solution is developed. Models may be trained and managed in Azure Machine Learning, Microsoft Fabric, Databricks or another data-science environment before their outputs are surfaced in Power BI.
Organizations without in-house capacity to build this kind of pipeline can also work with a specialized partner — see SmartDev’s Data Analytics services — to design the enrichment and modelling layer that ultimately feeds a Power BI semantic model.
What AI in Power BI Can and Cannot Do
AI in Power BI is most valuable when it accelerates clearly defined analytical work. It can help users find relevant patterns, generate summaries, detect anomalies, support forecasting and reduce some of the manual effort involved in building and interpreting reports.
In practical terms, Power BI AI can:
- Highlight factors associated with changes in business performance.
- Detect unusual movements in time-series data.
- Produce forecasts based on historical patterns.
- Summarize report pages and key metrics.
- Answer questions grounded in an available semantic model.
- Enrich datasets with text, language or image analysis.
- Display predictions produced by internal or external machine-learning models.
- Assist analysts with report creation and DAX development.
However, these capabilities have important limitations. Power BI cannot determine whether the underlying data is complete, unbiased or suitable for a particular decision unless the organization has established its own validation controls. It cannot reliably understand business definitions that have not been represented in the semantic model. It may also generate incomplete or misleading responses when measures, relationships and terminology are poorly configured.
AI-generated findings should therefore be treated as analytical support rather than unquestionable conclusions. Forecasts may become unreliable when market conditions change significantly. Influencer analysis may reveal statistical associations without demonstrating causality. Generative summaries can omit context or overstate the significance of a pattern.
Power BI also does not replace a complete data-science or AI engineering platform. Highly specialized models, real-time decision systems and complex unstructured-data pipelines generally need to be developed outside Power BI and then connected to it for reporting and analysis.
Why Semantic Models and Data Context Matter
The effectiveness of AI in Power BI depends heavily on the quality of the semantic model beneath the report.
A semantic model organizes data into business-ready tables, relationships, measures, hierarchies and definitions. It provides the context Power BI needs to understand what the data represents and how different fields should be interpreted. Microsoft describes semantic models as data sources prepared for reporting and visualization.
This context becomes particularly important when users interact with Copilot. When a question relates to organizational data, Copilot uses the semantic model to formulate its response. Poorly named fields, ambiguous measures, missing relationships and inconsistent definitions can therefore lead to inaccurate or confusing answers.
Consider a user asking, “Why did customer profitability decline last quarter?” Power BI must understand:
- How profitability is calculated.
- Which date field defines the quarter.
- What qualifies as a customer.
- How revenue and cost tables are related.
- Whether refunds, discounts and overhead costs are included.
- Which dimensions users are permitted to access.
Without this context, even a technically sophisticated AI system may produce an answer that is plausible but inconsistent with the organization’s actual business logic.
To make Power BI models more AI-ready, organizations should establish clear naming conventions, validated measures, accurate table relationships, consistent date structures and documented business definitions. Sensitive information should also be protected through appropriate permissions, row-level security and governance policies.
The central principle is straightforward: AI does not compensate for weak data foundations. The better Power BI understands the structure and meaning of the data, the more useful and trustworthy its AI-assisted analysis becomes.
3. Core AI Capabilities and When to Use Them
Power BI’s AI capabilities support different stages of the analytics process. Some help users explain historical results, while others accelerate report creation, enrich raw data or bring predictive outputs into business dashboards. The right capability depends on the question being asked. A business user investigating a sudden decline in revenue may need an AI visual, while an analyst forecasting customer churn may require a machine-learning model developed outside the report itself. Understanding these differences helps organizations select tools based on analytical needs rather than treating every AI feature as interchangeable.
AI Visuals for Explanation and Exploration
Power BI’s AI visuals are designed to help users investigate patterns, identify contributing factors and communicate findings without building a complete machine-learning workflow. They are most useful for exploratory and diagnostic analysis: understanding what happened, where it happened and which factors may be associated with the result.
Key Influencers
The Key Influencers visual analyzes the factors associated with a selected metric and ranks them according to their relative influence. It can evaluate categorical outcomes, such as whether a customer left, as well as continuous outcomes, such as satisfaction scores or transaction values. For example, a telecommunications company could use Key Influencers to examine which customer characteristics are most strongly associated with churn. A manufacturer might use it to investigate which operating conditions correspond with higher defect rates. Use Key Influencers when you need to:
- Identify variables associated with a particular outcome.
- Compare how different customer or operational segments behave.
- Generate initial hypotheses for further analysis.
- Explain the factors behind a metric to business stakeholders.
The visual is useful for identifying relationships, but those relationships should not automatically be interpreted as causal. A factor may correlate with an outcome without directly producing it. Microsoft describes the visual as a way to analyze and rank the factors that drive a selected metric.
Decomposition Tree
The Decomposition Tree breaks a metric down across multiple dimensions. Users can choose how to explore the data manually or allow Power BI to select high-value or low-value contributors through AI-assisted splits. For example, if operating costs increased, a user could decompose the total by region, facility, department, supplier and cost category. This makes it easier to trace an aggregated result back to the segments contributing most strongly to it.
Use the Decomposition Tree when you need to:
- Perform structured root-cause analysis.
- Investigate a KPI across several dimensions.
- Move from an executive-level metric to detailed contributors.
- Compare the strongest and weakest-performing segments.
The Decomposition Tree is particularly effective for interactive investigation because users can change the analytical path as new questions emerge. It works best when the semantic model contains clear hierarchies and relevant dimensions.
Smart Narrative
Smart Narrative automatically generates written summaries of visuals and report pages. It can describe prominent values, trends and changes while allowing report creators to customize the text with dynamic measures. For example, an executive dashboard could include a narrative explaining that revenue increased during the quarter while highlighting which region contributed most to the increase. The text updates as filters, slicers and report data change.
Use Smart Narrative when you need to:
- Provide a written summary alongside charts.
- Make reports easier for non-technical users to interpret.
- Add dynamic commentary to executive dashboards.
- Reduce the manual effort required to update recurring performance summaries.
Smart Narrative can improve accessibility and speed up communication, but its output should be reviewed carefully. Automatically generated summaries may identify visible trends without understanding their wider business significance. Microsoft includes Smart Narrative among Power BI’s visual-level AI capabilities.
Anomaly Detection
Anomaly Detection identifies unexpected spikes, dips and other unusual movements in time-series data displayed in line charts. Power BI can also provide possible explanations by examining related fields in the dataset.
This capability can help an operations team detect an unexpected increase in delivery times, a finance team identify unusual spending or an ecommerce company spot a sudden decline in conversion rates.
Use Anomaly Detection when you need to:
- Monitor time-series metrics for unusual changes.
- Surface potential operational or financial issues.
- Prioritize periods that require further investigation.
- Support exception-based reporting instead of reviewing every data point.
Anomaly Detection is best suited to historical time-series analysis. It does not independently determine whether an anomaly represents an error, a business risk or a legitimate event. Microsoft describes the feature as automatically highlighting unexpected spikes and dips in line-chart data.
Natural-Language and Generative AI Experiences
Natural-language capabilities allow users to interact with Power BI using business questions rather than relying entirely on manual visual configuration, DAX or predefined dashboard paths. Power BI currently includes both Copilot and the older Q&A experience. However, these capabilities represent different generations of the platform and should not be treated as equivalent long-term options.
Copilot in Power BI
Copilot is Microsoft’s primary generative AI experience for Power BI. It provides chat-based assistance for report consumers, analysts and report creators, with available capabilities varying according to the user’s role, environment and permissions.
Copilot can help users:
- Ask questions about reports and semantic models.
- Summarize report pages and identify key findings.
- Generate or modify report pages.
- Suggest relevant visuals for a business question.
- Create narrative summaries.
- Assist with DAX generation and explanation.
- Explore data through conversational prompts.
For business users, Copilot can shorten the path from a question to an initial insight. A user could ask why revenue changed, which products underperformed or how performance differed between regions without manually navigating every report page.
For report creators, Copilot can reduce some of the time required to generate visuals, build report structures and draft DAX calculations. Microsoft describes Copilot as a set of chat-based experiences covering tasks from ad hoc analysis to DAX generation.
Use Copilot when you need to:
- Make analytics more accessible to occasional report users.
- Accelerate initial report creation and exploration.
- Generate summaries for complex report pages.
- Support analysts while writing or interpreting DAX.
- Allow users to explore governed organizational data conversationally.
Copilot does not remove the need for a well-designed semantic model. It relies on the structure, terminology, measures and relationships available in that model. Ambiguous field names or inconsistent business definitions can result in generic, inaccurate or misleading answers.
Its use also depends on organizational configuration. Copilot must be enabled by an administrator and requires a supported Power BI or Fabric capacity. Some experiences differ between Power BI Desktop, the service and individual workspace configurations.
Users should validate significant findings before using them in financial, regulatory or operational decisions. Generative AI can provide a plausible response even when the data context is incomplete.
Legacy Q&A: Role and Platform-Direction Context
Power BI Q&A is an earlier natural-language feature that allows users to enter questions such as “sales by region this year” and receive an automatically generated visual. Historically, Q&A helped organizations provide self-service analytics to users unfamiliar with report-building tools. Its effectiveness depended on recognizable terminology, synonyms and a semantic model designed to support natural-language queries.
However, Microsoft has announced that Power BI Q&A experiences will be retired in December 2026 and recommends Copilot as the replacement for natural-language data exploration. Organizations should therefore treat Q&A as a legacy capability rather than the foundation of a new conversational analytics strategy.
Continue using Q&A when:
- It already supports an existing production report.
- Users rely on a stable and carefully configured set of questions.
- The organization needs to maintain functionality during migration planning.
Prioritize Copilot when:
- Designing new natural-language analytics experiences.
- Modernizing existing Q&A-enabled reports.
- Supporting broader conversational exploration and report summarization.
- Building a long-term Power BI roadmap beyond 2026.
The transition should include more than replacing one interface with another. Organizations should review semantic-model quality, capacity requirements, governance controls and user-training needs before moving to Copilot.
AI-Assisted Data Enrichment and Preparation
AI-assisted data enrichment applies analytical services to raw data before it reaches the final visualization layer. Rather than only displaying existing fields, Power BI can work with enriched attributes such as sentiment, language, topics, image labels or model-generated classifications.
Potential applications include:
- Detecting sentiment in customer feedback.
- Identifying the language used in support requests.
- Extracting key phrases from survey responses.
- Classifying text into business categories.
- Adding predictions or risk scores to operational records.
- Transforming unstructured content into reportable fields.
For example, a customer-service dashboard could combine case volumes and resolution times with sentiment scores extracted from customer messages. This would allow managers to analyze not only how quickly cases are closed but also how customers feel about the experience.
Power BI has historically exposed AI enrichment through Power Query, AI Insights and integrations with Azure services. In a modern architecture, some enrichment may also take place upstream in Microsoft Fabric, Azure Machine Learning, Azure AI services or another data platform before the results are loaded into a Power BI semantic model.
Use AI-assisted enrichment when:
- Important information is contained in text or other unstructured data.
- Existing datasets lack the classifications needed for analysis.
- The same enrichment process must be applied consistently at scale.
- Model-generated attributes need to be combined with operational KPIs.
Enrichment should usually occur before report rendering rather than every time a user opens a report. Processing data upstream makes the workflow easier to govern, test, refresh and reuse across multiple reports. Teams should also assess:
- Data privacy and residency requirements.
- API and compute costs.
- Refresh frequency and processing time.
- Model accuracy across languages and customer groups.
- How low-confidence classifications will be handled.
- Whether enriched data can be audited and reproduced.
AI-generated fields should be clearly identified in the data model so users do not mistake predictions or classifications for confirmed facts.
Predictive Modelling and External AI Integrations
Power BI can display predictive results, but it is not always the best environment for training, deploying and managing complex machine-learning models.
The appropriate architecture depends on model complexity, required refresh frequency, governance standards and the technical skills available within the organization.
AutoML and Azure Machine Learning
Automated machine learning simplifies parts of the model-development process by testing algorithms, selecting configurations and optimizing models with less manual intervention. AutoML can support use cases such as:
- Customer churn prediction.
- Lead-conversion scoring.
- Payment-default risk.
- Demand forecasting.
- Equipment-failure prediction.
- Delivery-delay classification.
Within Microsoft’s current analytics ecosystem, organizations may use AutoML capabilities through Microsoft Fabric or Azure Machine Learning and then make the resulting predictions available to Power BI. Azure Machine Learning supports model development, deployment and lifecycle management across frameworks including PyTorch, TensorFlow, scikit-learn, XGBoost and LightGBM.
Power BI then serves as the business-consumption layer, combining model outputs with operational and financial data.
Use AutoML when:
- The use case has a clearly defined target variable.
- Historical data is sufficient for training and evaluation.
- The organization needs a baseline model quickly.
- Data specialists can validate the selected model and its performance.
Use Azure Machine Learning when:
- Models require more control over training and deployment.
- The organization needs managed endpoints or formal model governance.
- Data scientists use specialized frameworks and feature-engineering pipelines.
- Models must be monitored for performance, drift and version changes.
- Predictions are consumed by applications beyond Power BI.
AutoML reduces some technical effort, but it does not eliminate the need to define the problem, validate the data or monitor the model after deployment.
Python and R Integrations
Power BI supports Python and R for data transformation and custom visualization. These integrations allow analysts to use statistical packages, machine-learning libraries and specialized charting techniques that are not available through standard Power BI functionality. Typical applications include:
- Statistical testing.
- Clustering and segmentation.
- Custom forecasting.
- Data preprocessing and feature engineering.
- Specialized scientific or financial visualizations.
- Exploratory machine-learning analysis.
Python and R visuals respond to filtering and other report interactions, although their rendering model and service limitations differ from native Power BI visuals. Microsoft supports Python and R integration for custom report visuals and data-processing scenarios.
Use Python or R when:
- A required statistical method is unavailable in native Power BI.
- Analysts already have tested scripts or models.
- The analysis requires specialized open-source libraries.
- A custom visual communicates the result more effectively than native charts.
They may be less suitable when:
- Reports require very fast rendering at large scale.
- Business users need to edit the analytical logic.
- The organization cannot manage package versions and script dependencies.
- The report must run consistently across tightly controlled environments.
The Power BI service supports only approved Python packages and does not support all private or custom packages in the same way as a local desktop environment. Deployment testing is therefore essential. Python and R scripts embedded directly in reports should also not be treated as a substitute for a managed production machine-learning pipeline. Complex or business-critical models are generally better hosted in a controlled external environment.
External Model Integration Considerations
Organizations are not limited to Microsoft-native models. Predictions generated by Azure Machine Learning, Microsoft Fabric, Databricks, cloud AI platforms, internal APIs or custom applications can be made available to Power BI. Common integration patterns include:
- Writing model predictions to a database or lakehouse.
- Calling a model during an upstream data pipeline.
- Connecting Power BI to a scored dataset.
- Using APIs or middleware to retrieve prediction results.
- Combining model outputs with business measures in a semantic model.
For scheduled business reporting, precomputing predictions and storing them in a governed data platform is often the most reliable approach. Real-time model calls from the reporting layer can introduce latency, refresh failures, higher costs and security complexity.
Before integrating an external model, teams should evaluate:
- Integration architecture: Determine whether predictions are produced in batches, on demand or in real time.
- Refresh alignment: Ensure model outputs are updated at a frequency consistent with the report and source data.
- Identity and security: Define how Power BI or the upstream pipeline authenticates with the external service.
- Scalability: Estimate the number of records, users and model requests the solution must support.
- Explainability: Provide users with enough context to understand the meaning and limitations of a score or recommendation.
- Monitoring: Track model accuracy, drift, service availability and changes between model versions.
- Auditability: Record which model version produced each prediction and when it was generated.
- Fallback behaviour: Decide what the report should display when the model or external service is unavailable.
- Cost: Account for model inference, data movement, storage, refresh and capacity consumption.
The most effective architecture is usually one in which the external AI platform manages model development and inference, while Power BI presents the results in a governed business context. This division allows each platform to perform the role for which it is best suited.
4. Practical AI Use Cases in Power BI
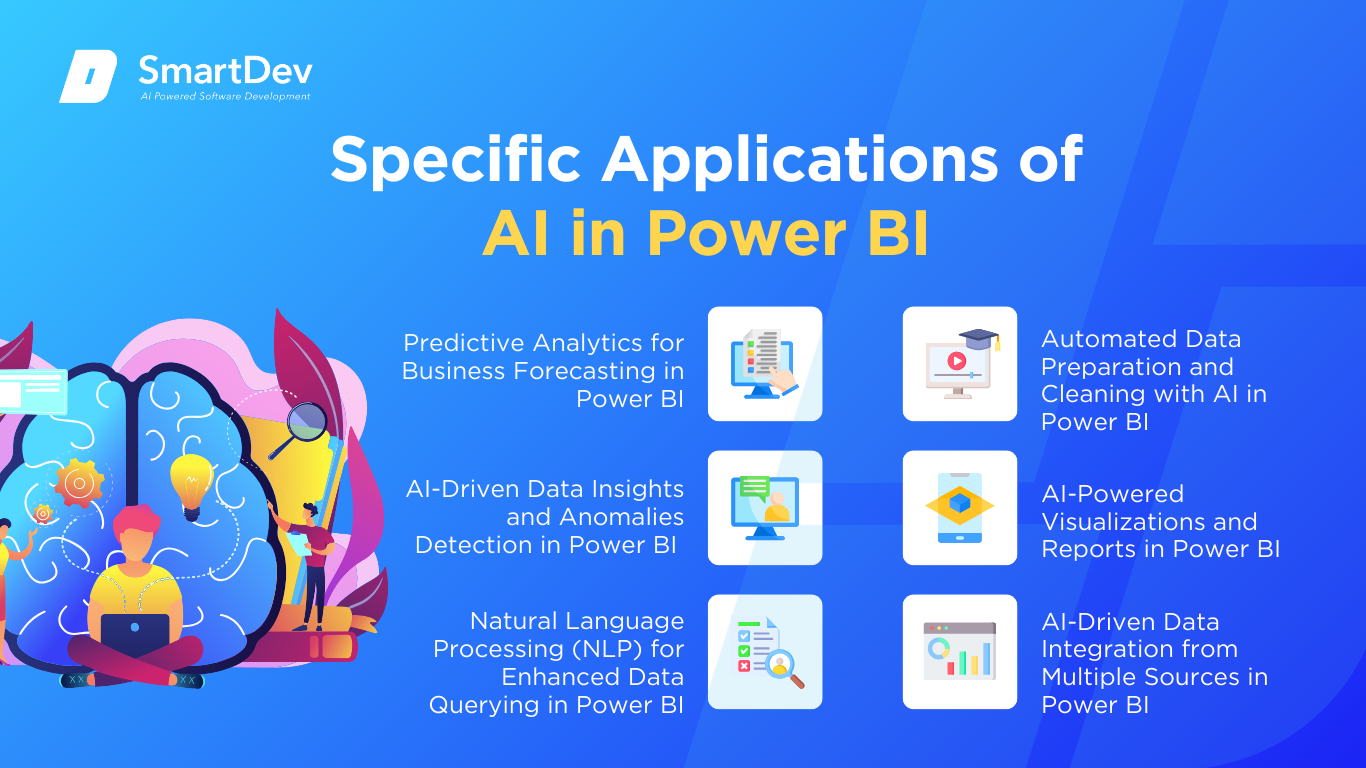
Power BI’s AI capabilities can support a wide range of analytical scenarios, from forecasting future demand to identifying unusual operational events and helping business users explore reports through natural language. However, different use cases require different technical approaches. Some can be handled with native Power BI visuals, while others depend on machine-learning models, data-enrichment services or upstream platforms such as Microsoft Fabric and Azure Machine Learning. The following use cases show where AI can create practical value and which capabilities are most appropriate for each scenario.
Forecasting Demand, Revenue, Capacity and Risk
Forecasting helps organizations estimate future outcomes based on historical patterns. In Power BI, this can range from straightforward time-series forecasting in a line chart to sophisticated predictive models developed in external machine-learning environments.
Common forecasting use cases include:
- Predicting product demand by region or channel.
- Estimating future revenue and cash flow.
- Planning workforce or infrastructure capacity.
- Forecasting inventory requirements.
- Identifying customers at risk of churn.
- Estimating the probability of payment default.
- Predicting delivery delays or equipment failures.
For relatively stable time-series data, Power BI’s native forecasting feature can extend a line chart into future periods using historical trends. It is useful for quick scenario exploration when the objective is to understand the likely direction of a metric rather than produce a business-critical prediction. Microsoft currently makes forecasting available through the Analytics pane for eligible line-chart configurations.
For example, a retail planning team could use historical weekly sales to estimate near-term demand. A service provider could forecast monthly ticket volumes to support workforce planning, while a finance team might project recurring revenue based on past performance.
More complex predictions require a machine-learning model rather than a standard chart forecast. Customer churn, credit risk and equipment failure depend on several variables and may require classification, regression or survival models trained in Microsoft Fabric, Azure Machine Learning, Python, R or another data-science environment. The model’s output can then be loaded into Power BI as a probability, score or predicted value. Business users can compare those predictions with customer, financial and operational data to decide where action is required.
Best suited capabilities:
- Native line-chart forecasting for basic time-series projections.
- Fabric or Azure Machine Learning for advanced predictive modelling.
- Python or R for specialized statistical analysis and prototypes.
- Power BI reports for presenting predictions in a business context.
Implementation considerations:
Forecasts are only as reliable as the historical data and assumptions behind them. Teams should evaluate seasonality, missing periods, unusual events, model error and changes in market conditions. A model trained on historical behaviour may become unreliable when customer demand, pricing or operating conditions shift significantly.
Predictions should therefore be presented with confidence ranges, assumptions and refresh dates where possible, rather than as guaranteed outcomes.
Detecting Anomalies and Operational Exceptions
Anomaly detection helps organizations identify observations that differ significantly from expected patterns. Instead of manually reviewing every metric, teams can focus on events that may require investigation.
Potential use cases include:
- Unexpected changes in sales or conversion rates.
- Unusual transaction volumes or payment values.
- Sudden increases in manufacturing defects.
- Abnormal energy consumption.
- Delivery-time spikes.
- Unexpected website traffic changes.
- Service outages or performance degradation.
- Unusual expense or procurement activity.
Power BI’s built-in Anomaly Detection capability works with time-series data in line charts. It automatically highlights unexpected spikes and dips and can examine related fields to suggest possible explanations.
For example, a logistics dashboard might flag an unusual increase in average delivery time during a specific week. Power BI could then analyze available dimensions such as route, warehouse, carrier or product type to identify possible contributors.
A manufacturing team could use the same approach to identify an unexpected rise in defect rates. The anomaly would act as an investigative starting point, directing users toward the period and operational dimensions that deserve further review.
Native anomaly detection is most appropriate when:
- The metric is represented as a time series.
- Historical patterns provide a meaningful baseline.
- Users need to identify unusual periods quickly.
- The objective is exploratory investigation rather than automated intervention.
More advanced anomaly detection may require an external model. Fraud detection, cybersecurity monitoring and equipment-health analysis often involve multiple features, large transaction volumes and rapidly changing patterns. These scenarios may require specialist models that score records upstream before the results are displayed in Power BI.
Power BI should not automatically treat every anomaly as an error or risk. A spike could reflect a successful campaign, seasonal demand, a data-quality issue or a genuine operational problem. Human review and business context remain necessary.
Explaining Drivers Behind Business Outcomes
Organizations often know that a KPI has changed but not why it changed. Power BI’s AI visuals can help users investigate the variables and segments associated with a particular result.
Typical questions include:
- What factors are associated with customer churn?
- Why did profit margins decline?
- Which segments contribute most to late deliveries?
- What characteristics are common among high-value customers?
- Which facilities are driving an increase in operational costs?
- What conditions are associated with higher defect rates?
The Key Influencers visual analyzes potential explanatory variables and ranks the factors associated with a selected outcome. Microsoft uses machine-learning techniques behind the visual to identify relevant influencers and segments within the available data. For example, an insurance company could analyze which customer, policy or service characteristics are associated with renewal. A retailer could examine which product and customer attributes are connected with higher return rates.
The Decomposition Tree provides a complementary approach. Rather than ranking potential influencers, it lets users break a metric down across multiple dimensions and explore the largest or smallest contributors.
A finance team investigating a cost increase could decompose the total by business unit, country, supplier, cost centre and expense category. Users can follow different analytical paths depending on the questions that emerge.
These capabilities are valuable for:
- Initial root-cause exploration.
- Business performance reviews.
- Segment analysis.
- Hypothesis generation.
- Interactive executive reporting.
However, the findings represent patterns and associations within the available data. They do not, by themselves, establish that one variable caused another. Important findings should be validated through domain expertise, controlled analysis or additional statistical testing.
Analysing Text, Sentiment and Unstructured Feedback
Many valuable business insights are contained in unstructured text rather than structured database fields. Customer reviews, survey responses, support tickets, emails, call transcripts and incident descriptions may reveal issues that numerical KPIs cannot fully explain.
AI-assisted text analysis can transform this content into structured attributes that Power BI can aggregate and visualize.
Common applications include:
- Classifying customer feedback by topic.
- Measuring sentiment across products or locations.
- Detecting recurring complaints.
- Extracting key phrases from survey responses.
- Categorizing support tickets.
- Identifying language or translation requirements.
- Summarizing recurring issues.
- Connecting qualitative feedback with customer and operational metrics.
For example, a customer-experience team could classify survey comments into themes such as delivery, product quality, pricing and customer service. Power BI could then show how sentiment differs by product line, region or customer segment.
A support team could analyze ticket categories alongside resolution times and satisfaction scores. This would help managers identify not only where ticket volumes are increasing, but also which topics generate the most negative feedback or require the longest resolution time.
The text-analysis process generally takes place before the data is displayed in Power BI. Organizations may use Azure AI services, Fabric notebooks, Azure Machine Learning, language models or another natural-language-processing platform to enrich the source data.
The enriched output might include:
- Sentiment label.
- Sentiment score.
- Topic category.
- Key phrases.
- Language.
- Urgency classification.
- Intent.
- Summary.
- Model confidence score.
Power BI can then combine these AI-generated attributes with structured data such as customer type, transaction history, location and service performance.
Important governance considerations include:
- Protecting personal and sensitive information.
- Testing performance across different languages and writing styles.
- Reviewing classifications with low confidence.
- Monitoring bias across customer groups.
- Keeping a record of the model and version used.
- Separating model-generated interpretations from confirmed facts.
Sentiment analysis should be treated as an indicator rather than a perfect measurement of customer emotion. Sarcasm, technical language, short messages and cultural differences can all reduce accuracy.
Creating and Consuming Reports with Natural-Language Assistance
Natural-language AI can reduce the technical barrier between business users and organizational data. Instead of navigating predefined report pages or creating every visual manually, users can describe what they want to investigate in ordinary language.
Copilot in Power BI supports generative and conversational experiences for both report creators and report consumers. Depending on the environment and available functionality, it can assist with report summaries, data questions, page creation, visual generation and DAX-related tasks.
A report consumer might ask:
- “Which regions missed their sales targets this quarter?”
- “Summarize the main changes in operating costs.”
- “What factors contributed to declining customer satisfaction?”
- “Compare this month’s revenue with the same month last year.”
Copilot can help users locate relevant findings within the available report and semantic model. This can make complex dashboards easier to consume, particularly for senior leaders and occasional users who may not know where every metric is located.
Report creators can use generative assistance to:
- Build an initial report page.
- Suggest relevant visualizations.
- Summarize a report.
- Draft or explain DAX measures.
- Explore the structure of a semantic model.
- Generate narrative descriptions of findings.
These capabilities can reduce repetitive authoring effort, but they do not remove the need for report design, validation and business knowledge. Copilot relies on the underlying semantic model, including field names, relationships, measures and descriptions. Poorly structured models can lead to incomplete or misleading responses.
Power BI Q&A also allows users to ask questions about semantic-model data and receive answers as automatically selected charts. However, Microsoft is retiring Power BI Q&A experiences in December 2026 and recommends Copilot as the strategic replacement. Organizations creating new natural-language experiences should therefore prioritize Copilot while developing a migration plan for reports that still depend on Q&A.
Natural-language assistance is most effective when:
- Business measures have clear, consistent names.
- Relationships within the model are accurate.
- Synonyms and business terminology are documented.
- Users have access only to authorized data.
- Important answers are validated before decisions are made.
- Report creators provide context and guidance for users.
Enriching Data from Multiple Systems and Sources
Power BI commonly brings together information from ERP systems, CRM platforms, cloud applications, databases, spreadsheets, APIs and data platforms. AI can add value to this process, but it should not be confused with basic data connectivity or transformation.
Power Query, dataflows, Fabric pipelines and other data-engineering tools normally handle tasks such as:
- Connecting to source systems.
- Standardizing formats.
- Removing duplicates.
- Combining tables.
- Applying transformation rules.
- Managing refresh schedules.
- Resolving common data-quality issues.
AI becomes useful when integration requires interpretation rather than deterministic rules.
Examples include:
- Matching customer records with inconsistent names.
- Categorizing transactions from descriptions.
- Mapping product records across different naming systems.
- Extracting information from documents.
- Classifying incoming support or operational data.
- Identifying potentially duplicated entities.
- Enriching records with predictions or risk scores.
Consider an organization that wants to combine customer records from its CRM, billing platform and support system. Standard transformations may align dates, identifiers and formats. However, an entity-resolution model may be needed where customer names, addresses or account details are inconsistent across systems.
Similarly, a logistics company may combine warehouse, transportation, sales and customer-service data. AI-generated delay-risk scores or classified incident descriptions can enrich the integrated dataset, but the underlying joins, business rules and data pipelines still need to be designed and governed explicitly.
The most reliable approach is usually to complete data matching, enrichment and model scoring upstream, then load the prepared results into a Power BI semantic model. This improves scalability, auditability and reuse across multiple reports.
Teams should avoid making real-time calls to external AI models directly from every report interaction unless the use case genuinely requires it. Such designs can create latency, cost, security and availability risks.
Selecting the Right Capability for Each Use Case
Choosing the right capability requires more than identifying an interesting AI feature. Organizations should consider the business question, required data, decision risk, technical complexity and governance requirements.
Use-Case-to-Capability Decision Matrix
| Use case | Recommended capability | Best suited for | Main limitation |
|---|---|---|---|
| Forecast a stable time-series metric | Native Power BI forecasting | Quick demand, revenue or workload projections | Limited for multivariable predictions |
| Predict churn, default or equipment failure | Fabric, AutoML or Azure Machine Learning | Advanced predictive modelling | Requires training data and model monitoring |
| Detect unusual changes in a KPI | Power BI Anomaly Detection | Time-series spikes and dips | Does not determine business significance |
| Investigate drivers of an outcome | Key Influencers | Identifying associated factors and segments | Association does not prove causality |
| Break a KPI into contributing segments | Decomposition Tree | Interactive root-cause exploration | Depends on relevant dimensions |
| Generate dynamic report commentary | Smart Narrative | Executive summaries and recurring reporting | Requires human review and context |
| Ask questions about organizational data | Copilot in Power BI | Conversational exploration and report consumption | Quality depends on the semantic model |
| Maintain an existing natural-language visual | Legacy Q&A | Existing reports during migration | Scheduled for retirement in December 2026 |
| Analyse customer comments or tickets | Azure AI, Fabric or external NLP model | Sentiment, topic and intent analysis | Accuracy varies by language and context |
| Apply specialized statistical methods | Python or R | Custom analysis and visualizations | Deployment and package limitations |
| Combine AI predictions with business KPIs | External model plus Power BI | Governed decision-support dashboards | Requires secure, reliable integration |
| Match inconsistent records across systems | Upstream entity-resolution model | Complex data consolidation | Requires validation and identity rules |
Required Data, Skills and Governance Checks
Before implementing an AI use case, teams should evaluate three areas.
Data readiness
- Is sufficient historical data available?
- Is the data complete, accurate and representative?
- Are the required variables present?
- Is there a reliable target variable for predictive modelling?
- Are timestamps, categories and identifiers consistent?
- Can the data be refreshed at the required frequency?
Technical and business skills
- Can the use case be implemented with native Power BI functionality?
- Is data-science or machine-learning expertise required?
- Who will validate model performance?
- Who understands the business process being analysed?
- Can the organization support the integration after deployment?
- Do report users understand how to interpret predictions and AI-generated findings?
Governance and risk
- Does the data contain personal, confidential or regulated information?
- Are users restricted to the data they are authorized to access?
- Can the organization explain how a score or recommendation was produced?
- Are predictions recorded with model versions and timestamps?
- How will errors, low-confidence outputs and exceptions be handled?
- Who is accountable for decisions informed by the model?
- How frequently will the model and semantic model be reviewed?
The best AI capability is not necessarily the most advanced one. A native Power BI visual may be sufficient for exploratory analysis, while a high-impact risk decision may require a governed machine-learning pipeline with formal validation and monitoring. Organizations should begin with a clearly defined business decision, select the simplest capability that meets the requirement and introduce additional complexity only when it creates measurable value.
Need Expert Help Turning Ideas Into Scalable Products?
Partner with SmartDev to accelerate your software development journey — from MVPs to enterprise systems.
Book a free consultation with our tech experts today.
Let’s Build Together5. Business Value and Decision Criteria
The business value of AI in Power BI does not come from adding more visuals or generating more reports. It comes from improving how quickly people identify important changes, understand their causes and decide what action to take.
In some scenarios, native Power BI capabilities can reduce analytical effort and make insights more accessible to business users. In others, AI adds complexity without materially improving the decision. Organizations therefore need to evaluate each use case against a clear business objective rather than adopting AI simply because the functionality is available.
Faster Insight Discovery and Self-Service Analysis
Traditional business intelligence often depends on predefined dashboards and requests submitted to specialist analytics teams. When users encounter a new question, they may need to wait for an analyst to create a report, adjust a model or write a new calculation.
AI-assisted Power BI experiences can shorten this cycle.
Features such as Copilot, Key Influencers, Decomposition Tree, Smart Narrative and Anomaly Detection help users move more quickly from a business question to an initial finding. Instead of manually reviewing every dimension or report page, users can ask questions, identify unusual movements and explore potential contributors through guided analytical experiences.
This can create value by:
- Reducing the time required to investigate routine business questions.
- Enabling non-technical users to explore governed data independently.
- Lowering the number of basic reporting requests sent to analytics teams.
- Helping report consumers identify relevant findings in complex dashboards.
- Allowing analysts to focus on higher-value modelling and interpretation.
- Accelerating recurring reporting and management-review processes.
For example, a regional manager investigating a decline in sales could use a Decomposition Tree to explore the result by country, channel, product and customer segment. Copilot could then help summarize the most significant changes. This does not eliminate the need for analyst review, but it can reduce the time required to locate the relevant issue.
Self-service value depends heavily on the quality of the semantic model. Users cannot reliably explore data independently when measures are inconsistent, field names are unclear or business definitions differ between reports. AI may make access easier, but it does not correct the underlying governance problem.
Organizations should therefore measure self-service success through outcomes such as:
- Time required to answer common business questions.
- Reduction in recurring ad hoc report requests.
- Percentage of users able to complete defined analytical tasks independently.
- Report adoption and repeat usage.
- Time analysts spend on routine report production.
- User confidence in the consistency of reported metrics.
Higher report usage alone does not prove that better decisions are being made. Adoption should be evaluated alongside accuracy, time savings and the actions resulting from the analysis.
Better Forecasting, Prioritisation and Exception Management
AI creates significant value when it helps organizations move from reviewing historical performance to prioritizing future action. Forecasting capabilities can support planning by estimating future demand, revenue, workload or capacity. Predictive models can rank customers, transactions or assets according to churn risk, default probability, failure likelihood or another business outcome. Anomaly Detection and external models can also support exception-based management. Instead of reviewing every transaction, location or operational metric, teams can focus their attention on cases that appear unusual or carry a higher predicted risk.
Potential business benefits include:
- More accurate inventory and capacity planning.
- Earlier identification of operational problems.
- Better prioritization of sales opportunities or customer-retention efforts.
- Faster investigation of unusual financial or operational events.
- More targeted allocation of limited staff and resources.
- Reduced time spent manually monitoring normal activity.
- Improved consistency in how cases are ranked and reviewed.
For example, a service operation may receive thousands of support cases each week. A predictive model could assign each case an escalation-risk score, while Power BI displays the highest-risk cases by team, product and region. Managers could then prioritize intervention instead of treating every case equally. The value does not come from the score itself. It comes from whether the score changes how the organization allocates resources and whether that change improves the outcome.
A useful business case should therefore connect the analytical output to an operational decision:
| Analytical output | Decision supported | Potential business measure |
|---|---|---|
| Demand forecast | Adjust inventory or staffing | Stock availability, overtime or carrying cost |
| Churn-risk score | Prioritize retention outreach | Retention rate or customer lifetime value |
| Anomaly alert | Investigate unusual activity | Time to detection or loss avoided |
| Failure prediction | Schedule preventive maintenance | Downtime or maintenance cost |
| Lead score | Prioritize sales follow-up | Conversion rate or sales-cycle length |
| Delay-risk prediction | Intervene in at-risk deliveries | On-time delivery rate or penalty cost |
Without a defined action, a prediction may remain an interesting dashboard element rather than a source of measurable value.
Where AI Creates Measurable Value and Where It Does Not
AI is most valuable when the business problem has repeated decisions, sufficient data and a clear way to act on the output. Strong use cases usually have several characteristics:
- A specific and recurring business decision.
- A measurable baseline process or performance level.
- Enough reliable data to identify meaningful patterns.
- A significant cost associated with delay, error or missed opportunities.
- An operational process capable of acting on the insight.
- Clear ownership of the resulting decision.
- A way to compare outcomes before and after implementation.
Examples include prioritizing customer-retention activity, detecting abnormal operational performance, forecasting demand and helping executives interpret recurring reports.
AI may create limited value when:
- The decision occurs too infrequently to justify implementation.
- The available data is too limited or inconsistent.
- A simple rule or calculation can solve the problem adequately.
- Users cannot act on the resulting insight.
- The process lacks a clear owner.
- The cost of integration and governance exceeds the likely benefit.
- The prediction is not accurate enough to change a decision.
- The business cannot tolerate false positives or false negatives.
- The use case requires causal explanation but only provides correlation.
A rule-based threshold may be more appropriate than machine learning when the logic is stable and transparent. For example, an organization does not need an AI model to flag invoices above an established approval limit. A conventional business rule is simpler to maintain, easier to audit and likely to produce a more reliable result.
Similarly, adding Copilot to a poorly designed reporting environment may not increase productivity. Users may receive faster answers, but those answers can remain inconsistent if reports rely on conflicting definitions or incomplete semantic models. Organizations should compare AI and non-AI approaches before implementation.
| Decision factor | AI-assisted approach | Conventional approach |
|---|---|---|
| Pattern complexity | Better for multivariable or non-obvious relationships | Better for simple, stable rules |
| Data requirement | Usually requires sufficient historical or contextual data | May operate with limited data |
| Explainability | May require additional interpretation and documentation | Often easier to explain |
| Maintenance | Requires monitoring and possible retraining | Usually easier to maintain |
| Scalability | Can prioritize large volumes of cases | Effective for predictable workflows |
| Error behaviour | May produce probabilistic or uncertain outputs | Usually produces deterministic results |
| Governance burden | Higher for sensitive or high-impact decisions | Generally lower |
| Best fit | Repeated decisions with complex patterns | Clear rules and established thresholds |
The appropriate question is not whether AI can be used. It is whether AI will improve the decision enough to justify the additional cost, uncertainty and governance requirements.
Evaluating the Business Case
A Power BI AI initiative should begin with a measurable hypothesis. For example: By using anomaly detection to prioritize unusual operational events, the team expects to reduce average investigation time from eight hours to four hours without increasing the number of missed critical incidents. This is stronger than a broad objective such as “use AI to improve operational reporting” because it defines:
- The capability being introduced.
- The process expected to change.
- The current baseline.
- The target outcome.
- A quality constraint.
A practical evaluation framework should consider five dimensions.
Business Impact
What financial, operational or customer outcome is expected to improve? Possible measures include:
- Revenue gained or protected.
- Cost avoided or reduced.
- Time saved.
- Error reduction.
- Faster response or resolution.
- Improved conversion or retention.
- Reduced downtime.
- Improved compliance performance.
Analytical performance
Does the capability produce sufficiently reliable outputs? Depending on the use case, relevant measures may include:
- Forecast error.
- Precision and recall.
- False-positive and false-negative rates.
- Classification accuracy.
- Model confidence.
- Coverage of relevant cases.
- Stability across different periods or user groups.
A technically accurate model may still deliver little value when its output does not support a meaningful action.
User adoption and workflow integration
Are users incorporating the capability into their actual decisions? Measures may include:
- Percentage of recommendations reviewed.
- Percentage of high-risk cases acted upon.
- Time from insight to action.
- Frequency of report or Copilot usage.
- User override rate.
- Completion rate for AI-assisted tasks.
- Reduction in manual analytical steps.
Operational cost
What does the capability cost to build and maintain? Organizations should account for:
- Power BI or Fabric capacity.
- Model-development effort.
- Data engineering and integration.
- API or inference charges.
- Report-development time.
- User training.
- Governance and security work.
- Model monitoring and retraining.
- Ongoing support.
Decision risk
What happens when the AI output is incorrect? A low-risk use case, such as summarizing a sales dashboard, may require relatively light controls. A high-impact use case, such as prioritizing credit or compliance cases, requires stronger validation, documentation and human oversight. The higher the cost of an incorrect output, the stronger the evidence and governance standards should be.
Evidence Standards for AI-Related Business-Case Claims
AI-related articles and business cases frequently cite improvements in productivity, revenue or decision speed without explaining how those results were calculated. Claims such as “30% faster decisions” or “20% lower operating costs” may sound persuasive, but they provide little value unless the underlying evidence is clear.
Any measurable claim should identify:
- The organization or sample studied.
- The process or use case involved.
- The Power BI or AI capability implemented.
- The baseline used for comparison.
- The period over which results were measured.
- Whether the result was observed, estimated or projected.
- Whether other technology or process changes contributed.
- The source of the evidence.
- Any important limitations or assumptions.
Evidence can be evaluated using the following hierarchy:
| Evidence level | Example | Reliability |
|---|---|---|
| Independently measured operational result | Audited performance data or peer-reviewed study | High |
| Documented customer case study | Named organization with defined implementation and metrics | Moderate to high |
| Vendor-commissioned economic study | Structured analysis with disclosed assumptions | Moderate |
| Internal pilot result | Before-and-after comparison within one organization | Moderate when methodology is clear |
| Survey or user estimate | Reported perception of time or productivity gains | Limited to moderate |
| Modelled projection | Expected value based on assumptions | Limited until validated |
| Unattributed marketing claim | Percentage without methodology or source | Low |
Vendor case studies can be useful, but they should not automatically be treated as proof that another organization will achieve the same result. Outcomes may depend on data maturity, implementation scope, user adoption and wider process changes.
When using a case study, the article should distinguish between:
- Reported result: A documented outcome attributed to the named organization.
- Estimated benefit: A projection based on a model or business-case assumption.
- Potential value: A plausible but unverified benefit.
- Illustrative scenario: A hypothetical example used to explain the capability.
These categories should not be presented interchangeably.
For example: AI in Power BI reduces reporting time by 40%.
In a documented internal pilot, the finance team reduced the time required to prepare its monthly management report from five days to three after standardizing its semantic model and introducing AI-assisted report summaries. The result reflects the combined impact of process redesign, data-model improvements and Power BI automation rather than AI alone. The stronger version provides the baseline, scope and contributing factors. It also avoids attributing the entire improvement to one feature without evidence.
Before approving an AI use case in Power BI, decision-makers should be able to answer the following questions:
| Decision question | What a strong answer should include |
|---|---|
| What business decision will improve? | A specific recurring action or choice |
| Who will use the output? | Named role, team or process owner |
| What happens after an insight appears? | Defined workflow, escalation or intervention |
| What is the current baseline? | Time, cost, error rate or performance level |
| Why is AI required? | Complexity that rules or standard reporting cannot address |
| Is the data sufficient? | Relevant, representative and governed information |
| How will success be measured? | Business, analytical and adoption metrics |
| What errors are acceptable? | Defined tolerance for false or inaccurate outputs |
| What oversight is required? | Human review and accountability structure |
| What is the total implementation cost? | Capacity, integration, support and governance |
| Can the result be reproduced? | Documented data, model, version and methodology |
AI in Power BI creates the most value when it is connected to a clear decision, embedded in an operational process and evaluated against credible evidence. Without these conditions, organizations risk producing more sophisticated analytics without achieving better business outcomes.
6. Prerequisites, Risks and Governance
AI capabilities in Power BI can make analytics faster and more accessible, but they also increase the importance of data quality, security and operational discipline. A conventional report usually presents measures and visuals that have been explicitly designed by an analyst. AI-assisted experiences introduce a more dynamic layer: users can ask new questions, generate summaries and explore combinations of data that report creators may not have anticipated.
This flexibility creates value, but it also exposes weaknesses more quickly. Poor data, ambiguous measures, excessive access permissions and unreliable refresh processes can all lead to answers that appear credible but do not reflect the organization’s intended business logic. Before expanding AI use in Power BI, organizations should evaluate five areas:
- Data and refresh readiness.
- Semantic-model preparation.
- Security and responsible use.
- Performance and operational reliability.
- User training and human oversight.
Data Quality, Modelling and Refresh Readiness
AI does not correct unreliable data foundations. It can summarize, classify and analyze the information it receives, but it cannot independently determine whether source records are complete, duplicated, outdated or inconsistent with business policy. Data readiness should therefore be assessed before selecting an AI feature or building a predictive use case.
Data quality requirements
The underlying data should be sufficiently:
- Complete: Required fields and historical periods are available.
- Accurate: Values reflect the source business process.
- Consistent: Definitions and formats are aligned across systems.
- Timely: Refresh frequency matches the decisions being supported.
- Representative: Training and analytical data cover relevant users, products and operating conditions.
- Traceable: Important values can be linked back to their source.
- Governed: Ownership and quality responsibilities are clearly assigned.
For example, an AI-assisted analysis of customer profitability will be unreliable if revenue is updated daily but cost allocations are refreshed only monthly. Similarly, a churn model may produce distorted results when cancelled accounts, inactive customers and temporary suspensions are classified inconsistently.
Teams should profile source data and define quality thresholds before implementation. Relevant checks may include:
- Missing-value rates.
- Duplicate-record rates.
- Referential-integrity failures.
- Invalid dates or category values.
- Unexplained changes in record volumes.
- Delayed source-system updates.
- Differences between operational totals and Power BI measures.
- Distribution changes that may indicate model drift or pipeline failure.
Data-quality issues should be surfaced visibly rather than silently corrected wherever the business meaning is uncertain.
Model structure and business logic
Power BI AI features work more reliably when the semantic model follows clear analytical design principles.
A well-structured model typically includes:
- Fact tables representing measurable business events.
- Dimension tables describing customers, products, dates, locations and other analytical categories.
- Clear one-to-many relationships.
- Explicit measures for important KPIs.
- Consistent date dimensions.
- Business-friendly table and field names.
- Hidden technical fields that users should not query directly.
- Limited ambiguity between similar concepts.
Microsoft describes Power BI semantic models as logical representations of an analytical domain containing business terminology, metrics and relationships. Star-schema structures are generally used to separate measurable facts from the dimensions used to filter and analyze them.
Model authors should avoid relying on raw columns when a governed measure is required. For example, “Revenue” should ideally refer to an approved DAX measure rather than allowing users or Copilot to choose between invoice amount, order amount, gross revenue and recognized revenue without guidance.
Refresh readiness
AI-generated answers can only be as current as the semantic model being queried. Import-mode semantic models require refresh processes to bring updated source data into Power BI, while on-premises and private-network sources may also depend on gateways.
Before deployment, teams should define:
- Required data freshness.
- Source-system update timing.
- Refresh dependencies.
- Gateway availability.
- Expected refresh duration.
- Failure notification and escalation.
- Recovery procedures.
- Whether reports should display the last successful refresh time.
Refresh schedules should align with actual source availability. Refreshing a semantic model before an upstream ERP or data-lake process has completed may produce technically successful but incomplete reporting. For large tables, incremental refresh can reduce the amount of data processed by refreshing only recent partitions rather than reloading the entire dataset. Microsoft recommends incremental refresh as a way to reduce refresh duration and improve capacity availability for large semantic models. Organizations should also recognize platform limits. For example, semantic models on shared capacity are limited to eight scheduled refreshes per day, while supported capacity-based environments provide different refresh options and resource profiles.
Preparing a Semantic Model for AI and Copilot
A semantic model that performs well in a conventional report is not automatically ready for conversational AI. Traditional reports restrict users to predefined pages, visuals and filters. Copilot can interpret broader questions across the model, which means unclear names, redundant fields and conflicting measures become more consequential. Microsoft now provides dedicated Power BI capabilities for preparing semantic models for AI, including:
- AI data schemas.
- Verified answers.
- AI instructions.
These controls help model authors define what Copilot should use, how business concepts should be interpreted and how important questions should be answered.
AI data schemas
An AI data schema allows model authors to select the subset of fields that Copilot should prioritize and use when answering questions. Instead of exposing every technical column, staging field and internal identifier, authors can create a simpler AI-facing view of the semantic model. Microsoft recommends prioritizing clean, relevant fields and excluding fields that could introduce ambiguity.
An effective AI data schema should include:
- Governed business measures.
- Clearly named dimensions.
- Relevant dates and hierarchies.
- Approved categorization fields.
- Fields that users are expected to ask about.
- Descriptions that clarify business meaning.
It should generally exclude:
- Technical keys.
- Duplicate representations of the same metric.
- Deprecated measures.
- Staging columns.
- Fields with unclear ownership.
- Sensitive fields that are not needed for the use case.
- Columns likely to encourage incorrect aggregation.
For example, a sales model may contain gross sales, net sales, invoiced sales, recognized revenue and local-currency revenue. Rather than exposing all fields without context, the AI data schema should prioritize the measures approved for general business analysis. The schema should then be tested with realistic questions. Microsoft recommends asking questions that reference both included and excluded fields to confirm that Copilot is following the intended schema.
Verified answers
Verified answers allow semantic-model authors to define approved responses to important or frequently asked business questions.
They are particularly useful when:
- A question has one governed interpretation.
- The calculation requires specific filters.
- Multiple measures could produce different answers.
- The wording of a KPI is potentially ambiguous.
- A high-impact answer needs to remain consistent across reports.
Microsoft states that verified answers are stored with the semantic model, helping provide consistent responses across reports that use that model. Examples might include:
- “What was recognized revenue last quarter?”
- “How do we calculate active customers?”
- “What is the current employee attrition rate?”
- “Which orders are considered late?”
- “What is the approved gross-margin measure?”
A verified answer should be based on validated logic rather than simply storing a preferred narrative. It should reflect the approved measure, date context, filters and definitions used by the organization. Verified answers are especially valuable in executive, financial and regulated reporting, where two plausible interpretations of the same question could lead to materially different decisions.
They should be reviewed whenever:
- A KPI definition changes.
- A measure is replaced.
- The fiscal calendar changes.
- New business units or products are added.
- Source-system logic is updated.
- A report is migrated to a different semantic model.
AI instructions
AI instructions allow model authors to provide business context and guidance directly within the semantic model. Microsoft describes them as a way to give Copilot additional context, business logic and specific guidance.
Instructions can help clarify:
- Which date field should be used by default.
- Which measures represent approved KPIs.
- How internal terminology should be interpreted.
- Which fields should not be combined.
- How particular business scenarios should be filtered.
- Which definitions take precedence where multiple alternatives exist.
- How to handle incomplete or unavailable information.
For example, instructions might specify that:
- “Revenue” means recognized net revenue unless the user explicitly asks for bookings.
- Fiscal-quarter questions should use the corporate fiscal calendar rather than the calendar quarter.
- Cancelled orders must be excluded from order-volume analysis.
- Customer churn refers only to customers with a terminated subscription, not temporarily inactive accounts.
This guidance should be concise, consistent and aligned with the model’s actual DAX logic.
Conflicting instructions can create unpredictable behaviour. Microsoft specifically warns against instructions that contradict verified-answer configurations and recommends using these tools to clarify ambiguous concepts such as competing date fields.
Additional AI-readiness practices
Beyond the dedicated preparation features, model authors should:
- Use plain, business-friendly names.
- Add descriptions to important tables, measures and columns.
- Hide unused or technical fields.
- Remove duplicated and deprecated measures.
- Define clear formatting and units.
- Create explicit measures rather than relying on implicit aggregation.
- Validate relationships and filter directions.
- Use a dedicated date table.
- Apply consistent terminology across related models.
- Test questions using the language employees actually use.
- Evaluate answers across different roles and access levels.
Testing should include both expected and adversarial questions. Teams should identify where Copilot:
- Selects the wrong measure.
- Applies the wrong date field.
- Combines unrelated concepts.
- Returns insufficient context.
- Cannot answer from available data.
- Produces a technically correct but operationally misleading response.
A model should not be approved for broad conversational access until common and high-impact questions have been evaluated.
Security, Privacy, Access and Responsible Use
AI in Power BI operates within a wider system of workspace access, semantic-model permissions, source-system security and organizational governance.
Copilot uses the semantic-model data available to the user together with the prompt provided to generate responses and visuals. This means the central security objective is not merely controlling whether Copilot is enabled. It is ensuring that users have access only to the data they are authorized to query.
Access control
Organizations should review:
- Workspace roles.
- Semantic-model permissions.
- App audiences.
- Build permission.
- Row-level security.
- Object-level security.
- Source-system credentials.
- Service-account access.
- Sharing and external-user settings.
- Export and download permissions.
Power BI semantic-model permissions determine how users can access, query, reshare and build content from a model. These permissions should be reviewed before conversational AI is introduced, because natural-language access can make it easier to explore information beyond the fields visible on a particular report page.
Row-level security should be tested explicitly with Copilot and not assumed to work correctly merely because it works in one report visual. Testing should include users from different:
- Regions.
- Business units.
- Management levels.
- Customer portfolios.
- Security groups.
- External partner roles.
Tenant settings can help control feature availability and establish governance policies, but Microsoft notes that these settings should not be treated as a substitute for actual access security. For example, disabling a user-interface export feature does not remove a user’s underlying permission to query a semantic model.
Data classification and privacy
Before enabling AI-assisted analysis, organizations should classify the data contained in each semantic model. Relevant categories may include public, internal, confidential, personal and financial data, health and employee information, trade secrets, and regulated or contractually restricted data.
Teams should determine whether the intended AI use is consistent with:
- Privacy notices.
- Customer agreements.
- Data-processing agreements.
- Data-residency requirements.
- Internal data-classification policies.
- Industry regulations.
- Cross-border transfer restrictions.
- Data-retention policies.
Sensitive fields that do not contribute to the analytical use case should be removed or excluded from the AI data schema. Prompts themselves may also contain sensitive information. Users should be trained not to paste confidential data, credentials or information from outside approved sources into prompts unless explicitly permitted.
Responsible use and decision risk
The level of oversight should reflect the consequences of an incorrect answer. A useful risk classification is:
| Use-case category | Example | Recommended oversight |
|---|---|---|
| Low impact | Summarizing a marketing dashboard | User review before circulation |
| Moderate impact | Prioritizing sales opportunities | Periodic validation and manager oversight |
| High impact | Flagging potential compliance breaches | Formal controls and documented human review |
| Very high impact | Supporting credit, employment or healthcare decisions | Specialist governance, legal review and strict decision controls |
Organizations building a broader governance framework for AI-assisted decisions — not just within Power BI — can also reference SmartDev’s business-oriented guide to responsible AI, which covers accountability, fairness and oversight practices for AI systems more generally.
AI-generated responses should be treated as decision support rather than automatically approved decisions. Reports should distinguish clearly between:
- Observed source data.
- Calculated measures.
- AI-generated classifications.
- Predictions.
- Generated summaries.
- User-entered assumptions.
For high-impact uses, the report should display relevant context such as:
- Model version.
- Prediction date.
- Confidence or uncertainty.
- Source-data period.
- Decision threshold.
- Known limitations.
- Required review steps.
Users should also have a clear process for challenging or reporting incorrect outputs.
Performance, Scale and Operational Reliability
AI adoption can increase usage, query volumes and model complexity. A semantic model that performs acceptably for a small group of report consumers may behave differently when many users begin asking open-ended questions through Copilot. Performance planning should cover the full chain from source systems, data pipelines, gateways, semantic models, capacity, reports, external AI services, and user concurrency.
Semantic-model performance
Performance depends on factors including:
- Model size.
- Storage mode.
- Relationship design.
- DAX complexity.
- Cardinality.
- Number of visuals.
- Query concurrency.
- Refresh overlap.
- DirectQuery source performance.
- Capacity configuration.
Power BI’s Performance Analyzer can show how long report visuals take to load and separate query time from other rendering activity. It also allows authors to inspect the DAX queries generated by visuals. Teams should use performance testing to identify:
- Slow measures.
- High-cardinality columns.
- Excessive calculated columns.
- Inefficient relationships.
- Visuals that issue many queries.
- DirectQuery bottlenecks.
- Resource contention during refresh.
For large models in supported Premium environments, Power BI provides a large semantic-model storage format that supports models beyond the standard 10 GB service limit and can improve some XMLA write scenarios. Large-model support does not remove the need for optimization. Loading unnecessary history or exposing excessive detail can still increase refresh time, memory consumption and query latency.
Capacity and concurrency
Capacity planning should account for:
- Number of active users.
- Peak usage periods.
- Copilot query volume.
- Report complexity.
- Refresh workload.
- External-model inference.
- Background Fabric workloads.
- Growth in data volume.
Refreshes and interactive report queries may compete for resources. Capacity monitoring should therefore examine both scheduled operations and user experience. Where relevant, organizations should:
- Schedule heavy refreshes outside peak reporting periods.
- Use incremental refresh.
- Reduce model complexity.
- Separate workloads across capacities.
- Monitor throttling and queueing.
- Test realistic concurrent usage.
- Establish thresholds for scaling or redesign.
Microsoft’s optimization guidance emphasizes capacity configuration, gateway sizing and network latency as important components of Power BI performance.
External service reliability
Where Power BI depends on Azure Machine Learning, Azure AI services, Fabric notebooks or third-party APIs, teams should define:
- Timeout behaviour.
- Retry logic.
- Rate limits.
- Service-level expectations.
- Authentication renewal.
- Cost controls.
- Version compatibility.
- Failure notifications.
- Fallback outputs.
For recurring reporting, it is often more reliable to score or enrich data upstream and store the results before the semantic-model refresh. This reduces the risk that a live external-model call will delay or break a report interaction. Reports should communicate when AI-generated data is unavailable or outdated rather than silently displaying an old result as current.
Monitoring and change management
Operational monitoring should cover:
- Refresh failures.
- Gateway availability.
- Semantic-model changes.
- Capacity utilization.
- Query performance.
- Copilot answer quality.
- External-model failures.
- Data-distribution changes.
- User-reported errors.
- Security and permission changes.
A release process should be established for changes to:
- Measures.
- Relationships.
- AI data schemas.
- Verified answers.
- AI instructions.
- External models.
- Prediction thresholds.
- Security rules.
Changes should be tested in a non-production environment before broad release, particularly where the semantic model supports high-impact decisions.
Training, Adoption and Human-in-the-loop Review
AI features do not automatically create self-service analytics. Users need to understand what the tools can answer, how to ask useful questions and when to challenge the output. Training should be tailored to different roles.
Report consumers
Report consumers should learn:
- Which semantic models and reports are approved.
- How to ask specific, context-rich questions.
- How filters and time periods affect answers.
- How to distinguish a summary from a verified fact.
- When an answer requires further validation.
- How to report an incorrect or concerning response.
For example, “Why are sales down?” may be too broad. A stronger question would be: Compare recognized net revenue in Q2 2026 with Q2 2025 and identify the product categories contributing most to the decline. The improved prompt defines the measure, periods and analytical objective.
Analysts and report creators
Creators should understand:
- Semantic-model design for AI.
- AI data-schema configuration.
- Verified answers.
- AI instructions.
- Security testing.
- Prompt and response evaluation.
- Performance testing.
- Documentation requirements.
They should also be trained to avoid accepting generated DAX, visuals or narratives without reviewing the underlying logic.
Copilot can accelerate development, but generated measures may still:
- Use the wrong filter context.
- Reference an inappropriate field.
- Ignore organizational definitions.
- Produce inefficient queries.
- Return correct syntax but incorrect business logic.
Generated content should follow the same review and testing standards as manually created content.
Business owners and subject-matter experts
Business owners should validate:
- KPI definitions.
- Accepted terminology.
- Approved interpretations.
- Important verified answers.
- Operational thresholds.
- Escalation procedures.
- Decision consequences.
Semantic-model preparation should not be owned by the technical team alone. The model represents business meaning, so domain experts must confirm that AI instructions and approved answers reflect actual policy and practice.
Human review
The required level of review should be based on risk.
Human review may include:
- Checking source values.
- Confirming filters and time periods.
- Reviewing generated DAX.
- Validating an anomaly against operational context.
- Assessing prediction confidence.
- Comparing the result with another approved report.
- Recording the final decision and rationale.
For important outputs, organizations should define who is permitted to:
- Accept the result.
- Override it.
- Escalate it.
- Correct the underlying model.
- Communicate it externally.
Human oversight should not be treated as a vague instruction to “check the AI.” It should be an explicit step in the workflow with defined ownership.
Governance Checklist
Before releasing an AI-enabled Power BI experience, teams should confirm the following:
| Governance area | Readiness question |
|---|---|
| Business purpose | Is the decision or analytical task clearly defined? |
| Data quality | Has the source data been profiled and validated? |
| Semantic model | Are measures, relationships and terminology approved? |
| AI data schema | Is Copilot limited to relevant, understandable fields? |
| Verified answers | Are critical recurring questions governed? |
| AI instructions | Is business context documented without contradictions? |
| Security | Have permissions and row-level security been tested? |
| Privacy | Is the use consistent with data policies and regulations? |
| Refresh | Are freshness requirements and failure procedures defined? |
| Performance | Has the model been tested under realistic usage? |
| Reliability | Are external-service failures handled visibly? |
| Human review | Is oversight proportional to decision risk? |
| Training | Do users understand both capabilities and limitations? |
| Monitoring | Are quality, performance and incidents tracked? |
| Change control | Are model and instruction changes reviewed before release? |
The central governance principle is that conversational access should not mean uncontrolled access. Power BI AI performs best when it operates on a deliberately prepared semantic model, within tested security boundaries and with clear human accountability.
7. How to Implement AI in Power BI
Implementing AI in Power BI should not begin with enabling Copilot or selecting an AI visual. It should begin with a clearly defined business decision and a measurable reason for improving it. A successful implementation connects four elements:
- A specific business question or workflow.
- Reliable and appropriately governed data.
- A Power BI or external AI capability suited to the problem.
- An operating process that turns the analytical output into action.
Organizations should start with a limited pilot, measure its performance against an existing baseline, and expand only when the capability produces reliable and repeatable value.
Step 1: Define the Business Decision and Success Metric
The first step is to identify the decision, action, or analytical task that the AI capability is expected to improve. Broad objectives such as “use AI to improve reporting” or “make dashboards more intelligent” are not sufficiently specific. They do not establish who will use the capability, what behaviour should change, or how success will be measured. A stronger implementation objective connects the AI capability to a recurring business decision. For example: Use Power BI Anomaly Detection to help operations managers identify unexpected increases in delivery time and reduce the average time required to investigate service exceptions.
This objective defines:
- The intended user.
- The metric being monitored.
- The capability being evaluated.
- The operational activity expected to improve.
- A measurable outcome.
This discipline mirrors the broader sequencing organizations should follow before any AI initiative, a theme explored further in SmartDev’s practical guide to business AI transformation, which walks through how to prioritize and stage AI adoption across an organization rather than around a single tool.
Other examples include:
- Help sales managers identify the customer segments contributing most to declining conversion rates.
- Enable finance leaders to obtain governed summaries of monthly performance without requesting manual report commentary.
- Prioritize customer-retention activity using churn-risk predictions displayed in Power BI.
- Reduce the time analysts spend answering recurring executive questions.
- Identify unusual manufacturing performance before it creates significant downtime or waste.
Establish the baseline
Before building the solution, document how the process currently operates.
Relevant baseline measures may include:
- Time required to prepare or interpret a report.
- Number of manual steps.
- Volume of recurring analyst requests.
- Forecast error.
- Average time to identify an exception.
- Average time from insight to action.
- Number of cases reviewed manually.
- False-positive or missed-event rate.
- User adoption of existing reports.
- Cost associated with delayed or incorrect decisions.
Without a baseline, it becomes difficult to distinguish genuine improvement from perceived convenience.
Define success metrics
The implementation should include both business and analytical measures.
| Measurement category | Example metrics |
|---|---|
| Business outcome | Revenue protected, cost reduced, downtime avoided |
| Process efficiency | Time saved, manual steps removed, faster investigation |
| Analytical quality | Forecast error, precision, recall, response accuracy |
| User adoption | Active users, questions submitted, recommendations reviewed |
| Operational impact | Cases prioritized, alerts investigated, actions completed |
| Risk and control | Incorrect outputs, overrides, security incidents |
A forecasting pilot, for example, should not be judged only on whether it produces a forecast. It should be evaluated against an existing planning method and measured using an appropriate error metric.
A Copilot pilot should not be judged only by user enthusiasm. Teams should test whether users receive correct, relevant, and consistent answers to defined business questions.
Set acceptance thresholds
Before development begins, define the minimum standard required for the pilot to proceed. An acceptance threshold could state that:
- At least 90% of approved test questions must return the correct measure and time period.
- The forecast must improve on the current baseline method.
- The report must load within the organization’s performance target.
- Row-level security must produce the correct result for every tested role.
- The capability must reduce investigation time without increasing missed incidents.
- No high-impact answer may be distributed without human validation.
These thresholds reduce the risk of declaring a pilot successful merely because the technology works technically.
Step 2: Assess Data, Model, and Governance Readiness
Once the business decision is defined, assess whether the underlying environment can support it. This assessment should cover:
- Data quality.
- Semantic-model design.
- Refresh reliability.
- Security and privacy.
- Licensing and capacity.
- Technical skills.
- Operational ownership.
Assess data readiness
Determine whether the required data is:
- Available for a sufficient period.
- Complete enough for the intended analysis.
- Consistent across systems and business units.
- Updated at the required frequency.
- Representative of the population or process being analysed.
- Governed by an identifiable owner.
- Permitted for the proposed AI use.
For predictive modelling, teams should also confirm whether a reliable target variable is available. A churn model, for example, requires a consistent definition of churn and enough historical examples of customers who did and did not leave. For anomaly detection, the metric should contain enough historical observations to establish a meaningful pattern. For natural-language analysis, measures and dimensions must reflect the terminology users are expected to use.
Review the semantic model
The semantic model should contain:
- Validated relationships.
- Explicit measures for important KPIs.
- Clear table and field names.
- Consistent date logic.
- Approved business definitions.
- Hidden technical or irrelevant columns.
- Appropriate descriptions and formatting.
- Tested security rules.
For Copilot scenarios, the model should also be prepared using the available AI-readiness features. Microsoft’s current Power BI preparation workflow includes AI data schemas, verified answers, and AI instructions. These features are designed to reduce ambiguity and improve how Copilot interprets a semantic model.
An AI data schema should prioritize the fields and measures Copilot needs while excluding technical or confusing elements. Verified answers can provide governed responses to important recurring questions, while AI instructions can clarify terminology, default filters, and business rules. The team should prepare a test set of realistic questions, including:
- Common user questions.
- Ambiguous questions.
- Questions involving multiple date fields.
- Questions referring to internal terminology.
- Questions users should not be able to answer.
- Questions involving restricted data.
- Questions outside the model’s scope.
Confirm refresh and pipeline readiness
The model must be refreshed reliably enough to support the intended decision. The review process is from source-system availability, refresh schedules, gateway dependencies, upstream pipeline completion times, refresh duration, failure alerts to last-refresh visibility.
Power BI provides refresh history through several service locations, including monitoring and semantic-model details. This information should be incorporated into operational monitoring rather than checked only after users report stale data. Where several datasets or upstream processes must run in sequence, the organization may need an orchestrated data pipeline rather than independent refresh schedules.
Check licensing and capacity
Copilot is not available solely through a Power BI Pro or Premium Per User licence. Microsoft currently requires supported organizational capacity and administrative enablement. Current documentation lists paid Fabric capacity from F2 or Power BI Premium P1 as supported entry points for relevant Copilot experiences.
Before selecting Copilot, confirm:
- Tenant and capacity settings.
- Workspace assignment.
- User roles.
- Regional availability.
- Capacity workload.
- Expected query volumes.
- Cost implications.
Requirements and feature availability may change, so licensing and capacity checks should be repeated before production approval.
Conduct a governance assessment
The governance review should determine:
- Which data classifications are involved.
- Whether personal or regulated information is present.
- Which users may access the solution.
- Whether row-level or object-level security is required.
- How prompts and generated responses will be handled.
- Whether external AI services receive data.
- What human review is required.
- How results will be recorded and audited.
- Who can approve changes.
A low-impact report-summary use case may require relatively simple controls. A model used to prioritize compliance, credit, employment, or health-related cases requires more formal validation and oversight.
Step 3: Select the Appropriate Power BI AI Capability
The implementation team should select the simplest capability that can solve the defined problem. Using a more advanced AI technique does not automatically produce greater value. Additional complexity introduces cost, maintenance, explainability, and governance requirements.
Match the capability to the question
| Business requirement | Appropriate starting capability |
|---|---|
| Identify unusual movement in a time-series metric | Anomaly Detection |
| Explore factors associated with an outcome | Key Influencers |
| Break a KPI into contributing dimensions | Decomposition Tree |
| Generate dynamic written commentary | Smart Narrative |
| Help users ask questions about governed data | Copilot |
| Create a basic time-series projection | Native forecasting |
| Predict churn, failure, or default | Fabric, AutoML, Azure Machine Learning, Python, or R |
| Analyse feedback or support text | Azure AI, Fabric, or an external NLP model |
| Display scores created by another platform | External model integration |
| Apply a simple, transparent threshold | Conventional rule rather than AI |
Choose between native and external capabilities
A native Power BI feature is generally preferable when:
- The analytical question is relatively focused.
- Users need interactive exploration.
- The existing semantic model contains the required data.
- The result is primarily diagnostic or explanatory.
- A low-code implementation is sufficient.
- The risk of an incorrect suggestion is manageable.
An external model may be more appropriate when:
- The prediction depends on many variables.
- Model training and retraining are required.
- Formal versioning and monitoring are needed.
- The model serves systems beyond Power BI.
- Real-time or high-volume scoring is required.
- Specialized algorithms or libraries are necessary.
- The decision has significant financial, regulatory, or customer consequences.
In these cases, Power BI should typically present the model output rather than manage the entire machine-learning lifecycle.
Avoid unnecessary AI
Before confirming the capability, ask whether the requirement could be met through:
- A governed DAX measure.
- A standard visualization.
- A rule-based alert.
- A parameter or filter.
- Improved report navigation.
- Better source-data quality.
- A simpler workflow change.
A deterministic rule is usually more appropriate when the decision logic is clear, stable, and easily audited.
Step 4: Build and Test a Focused Pilot
The pilot should be narrow enough to evaluate quickly but realistic enough to reveal production risks. A strong pilot usually includes:
- One defined business decision.
- One user group or team.
- A limited number of measures and dimensions.
- A representative sample of data.
- A documented baseline.
- Agreed success thresholds.
- A named business owner.
- A defined review period.
Avoid beginning with an enterprise-wide Copilot rollout or a large collection of loosely related AI features. Broad pilots make it difficult to determine which capability created value or where an error originated.
Design the pilot
The pilot design should document:
- Business question.
- Intended users.
- Data sources.
- Semantic model.
- Selected AI capability.
- Test scenarios.
- Expected outputs.
- Security roles.
- Performance targets.
- Human-review requirements.
- Success and failure criteria.
For a Copilot pilot, the team might select one certified sales semantic model and test a defined set of executive and managerial questions. For an anomaly-detection pilot, the team might monitor one operational KPI across a selected group of sites. For a predictive pilot, the team might score one customer segment and compare the results with the current prioritization method.
Use separate development and test environments
AI-related content should follow the same lifecycle controls as other business-critical Power BI solutions.
Microsoft’s Power BI implementation guidance recommends structured content lifecycle management and controlled deployment processes. Deployment pipelines can support movement between development, test, and production environments in appropriate capacity configurations.
The pilot should not be developed directly in a production workspace unless it is an isolated, low-risk proof of concept with no access to sensitive data.
Create a test library
A structured test library makes AI evaluation more repeatable.
For Copilot, include:
- Correctly phrased questions.
- Informal user wording.
- Synonyms.
- Misspellings.
- Ambiguous time periods.
- Competing business definitions.
- Unsupported questions.
- Restricted-data questions.
Record:
- The prompt.
- The expected result.
- The actual result.
- The measure and filters used.
- Whether the output was acceptable.
- Any correction required.
For forecasts and predictive models, test:
- Historical backtesting.
- Different time periods.
- Different regions or segments.
- Missing and unusual values.
- Performance against a simpler baseline.
- False-positive and false-negative consequences.
For AI visuals, verify that:
- The selected fields are appropriate.
- Relationships are configured correctly.
- Findings remain stable under filters.
- Users understand that association is not causation.
- Explanations are consistent with domain knowledge.
Conduct user acceptance testing
Technical validation is not sufficient. Intended users should complete realistic tasks using the pilot.
Observe:
- Whether they understand the output.
- Whether they ask effective questions.
- Whether they know when to verify a result.
- Whether the capability changes their workflow.
- Whether they can identify incorrect or incomplete responses.
- Whether the interface saves meaningful time.
Users should not be guided so heavily during testing that the pilot fails to reflect actual working conditions.
Step 5: Validate Outputs, Monitor Quality, and Scale
A pilot should move to production only after its analytical quality, security, performance, and business value have been validated. Validation should be appropriate to the capability.
For Copilot and generated summaries:
- Confirm that the correct measure is used.
- Verify filters and time periods.
- Compare results with an approved report.
- Check whether important caveats are omitted.
- Test consistency across alternative question wording.
- Confirm that security restrictions are respected.
For forecasts:
- Compare predictions with actual outcomes.
- Calculate forecast error.
- Compare performance with the current method.
- Review behaviour during unusual periods.
- Monitor whether accuracy declines over time.
For predictive models:
- Measure precision, recall, or other relevant metrics.
- Examine false-positive and false-negative impacts.
- Validate performance across important user or customer groups.
- Record model versions and scoring dates.
- Test whether users act on the predictions appropriately.
For anomaly detection:
- Review whether flagged periods represent meaningful exceptions.
- Measure how many alerts result in action.
- Track alert fatigue.
- Monitor missed incidents.
- Reassess the metric when normal business patterns change.
Measure business impact
Compare the pilot results with the baseline established in Step 1. Questions should include:
- Did the capability reduce time or effort?
- Did it improve forecast or prioritization quality?
- Did users act more quickly?
- Did outcomes improve?
- Did the capability introduce new errors or delays?
- Was the value sufficient to justify capacity and implementation costs?
- Did users continue using it after the initial novelty period?
A technically impressive pilot should not scale when it does not produce a meaningful workflow or business improvement.
Monitor performance and reliability
Power BI’s Performance Analyzer can help report authors investigate visual-load time and DAX-query performance. It should be used during development and after significant report or model changes.
Operational monitoring should cover:
- Semantic-model refreshes.
- Query performance.
- Capacity utilization.
- Gateway failures.
- External-model availability.
- Data freshness.
- Copilot response quality.
- Security changes.
- User-reported errors.
Microsoft also provides semantic-model operation logs for monitoring areas such as refresh duration, processing, health, and usage in supported Fabric environments.
Define scaling criteria:
- Success metrics have been met.
- High-impact test questions pass consistently.
- Security controls have been validated.
- Performance remains acceptable under realistic usage.
- Users understand the output.
- Ownership and support processes are established.
- Costs are understood.
- A monitoring process exists.
- A rollback or fallback option is available.
Scaling may involve:
- Adding more users.
- Adding further business units.
- Expanding the AI data schema.
- Introducing additional verified answers.
- Increasing data volume.
- Moving from batch to more frequent scoring.
- Integrating the output into operational workflows.
Scale one dimension at a time where possible. Expanding users, models, data, and business processes simultaneously makes problems harder to isolate.
Revalidate after changes
AI quality can change when:
- New data sources are added.
- Measures are modified.
- Relationships change.
- Business terminology changes.
- Models are retrained.
- User groups expand.
- Capacity or refresh architecture changes.
- Power BI features are updated.
Material changes should trigger regression testing against the existing question and scenario library.
Step 6: Enable Users and Establish Operating Ownership
Production deployment is not the end of the implementation. AI-enabled Power BI experiences require ongoing ownership, user support, quality monitoring, and controlled improvement.
Define roles and responsibilities
A practical operating model may include:
| Role | Primary responsibility |
|---|---|
| Business owner | Defines the decision and approves business logic |
| Semantic-model owner | Maintains measures, relationships, and AI preparation |
| Report owner | Maintains the report and user experience |
| Data owner | Ensures source quality and availability |
| Platform administrator | Manages tenant settings, capacity, and access |
| Security or governance owner | Reviews privacy, permissions, and responsible use |
| Data scientist or AI engineer | Maintains external predictive models |
| Support team | Handles incidents and user questions |
| End user | Reviews outputs and remains accountable for decisions |
A Center of Excellence or central BI team can coordinate standards, enablement, monitoring, and governance across multiple Power BI solutions. Microsoft’s implementation guidance assigns strategic and tactical planning responsibilities to BI teams, IT functions, and Centers of Excellence.
Train users by role
Training should reflect how each group interacts with the solution.
Report consumers should learn:
- What questions the capability can answer.
- How to write specific prompts.
- How filters and security affect responses.
- How to validate important findings.
- When not to rely on generated output.
- How to report an incorrect answer.
Analysts and model authors should learn:
- Semantic-model preparation for AI.
- AI data schemas.
- Verified answers.
- AI instructions.
- DAX and model validation.
- Security testing.
- Performance monitoring.
- Change-control requirements.
Business owners should learn:
- How success is measured.
- What errors are possible.
- What human review is required.
- How definitions and verified answers are approved.
- How process outcomes should be monitored.
Microsoft’s current Copilot guidance emphasizes preparing not only the semantic model but also the users who will interact with it.
Establish support and feedback channels
Users should have a defined way to:
- Report incorrect outputs.
- Request new verified answers.
- Suggest terminology improvements.
- Identify missing data.
- Report security concerns.
- Request access.
- Ask for additional training.
Feedback should be reviewed regularly rather than collected without action.
A useful review process classifies feedback into:
- Data-quality issue.
- Semantic-model issue.
- AI instruction issue.
- Verified-answer gap.
- User-training issue.
- Platform limitation.
- Security concern.
- New use-case request.
Production documentation should clearly define the solution’s business purpose, intended users, data sources, KPI definitions, and ownership of the semantic model. It should also record the AI capabilities in use, relevant AI instructions and verified answers, security design, refresh schedules, external model dependencies, known limitations, human-review requirements, support contacts, and a history of significant changes.
For predictive models, documentation should go further by capturing how the model was developed and maintained. This includes the training period, features used, model version, validation results, decision thresholds, retraining process, and approach to monitoring model drift over time.
Review the solution periodically
The operating owner should schedule reviews covering:
- Business value.
- User adoption.
- Answer quality.
- Model performance.
- Data freshness.
- Security access.
- Capacity consumption.
- Incident history.
- Feature changes.
- Training needs.
Solutions that no longer support an active decision should be revised or retired rather than allowed to remain as unmanaged AI-enabled content.
Implementation Checklist
| Implementation stage | Key approval question |
|---|---|
| Business definition | Is the decision and expected value clearly defined? |
| Baseline | Is current performance documented? |
| Data readiness | Is the required data accurate, sufficient, and timely? |
| Semantic model | Are measures, definitions, and relationships governed? |
| AI preparation | Are schemas, instructions, and verified answers configured where relevant? |
| Capability selection | Is this the simplest appropriate solution? |
| Security | Have permissions and restricted-data scenarios been tested? |
| Pilot | Is the scope focused and measurable? |
| Validation | Do outputs meet agreed quality thresholds? |
| Performance | Does the solution perform under realistic usage? |
| Business impact | Has measurable value been demonstrated? |
| Ownership | Are operational responsibilities assigned? |
| Training | Can users interpret and challenge the output appropriately? |
| Monitoring | Are quality, refresh, performance, and incidents tracked? |
| Scaling | Are there clear criteria for controlled expansion? |
The most reliable implementation path is to begin with one well-defined decision, build on a governed semantic model, test with representative users, and scale only after both analytical quality and business value have been demonstrated.
8. Measuring ROI from AI in Power BI
Measuring ROI from AI in Power BI requires more than tracking how often employees use Copilot, generate reports, or interact with AI-powered visuals. The real question is whether these capabilities improve a business process in a measurable way such as reducing analysis time, improving forecast accuracy, identifying risks earlier, or helping teams make better decisions. A credible ROI assessment should compare performance before and after implementation, account for the full cost of the solution, and separate improvements created by AI from those resulting from better data, redesigned workflows, or broader reporting improvements.
For a deeper look at how to structure this kind of business case, see AI Return on Investment (ROI): Unlocking the True Value of Artificial Intelligence for Your Business, which examines ROI methodology, evidence standards and cost accounting that apply well beyond a single Power BI deployment.
Define Baseline Metrics Before Implementation
ROI measurement should begin before the AI capability is deployed. Without a clear baseline, organizations may be able to show that employees are using a new feature but not whether it actually improves performance.
The baseline should reflect the specific process being changed. If Copilot is introduced to reduce repetitive requests to the BI team, organizations might measure the number of monthly requests, the average analyst time required to respond, and the time business users wait for an answer. If anomaly detection is introduced for operational monitoring, the baseline might instead focus on how quickly abnormal events are detected, investigated, and resolved.
The same principle applies to forecasting and predictive use cases. Existing forecast accuracy, manual review volumes, error rates, or decision turnaround times should be documented before the pilot begins. Ideally, the baseline should cover several representative reporting cycles so that seasonal effects or unusual operating conditions do not distort the comparison.
Operational, Financial, and Decision-Quality Metrics
The value of AI in Power BI can usually be evaluated across three dimensions: operational efficiency, financial impact, and decision quality.
Operational metrics measure whether AI reduces the effort required to work with data. This may include shorter report-development cycles, less time spent producing recurring management commentary, fewer manual analytical steps, faster investigation of exceptions, or fewer routine questions being escalated to BI teams. For example, if Copilot allows business managers to answer recurring performance questions independently, the organization may reduce the analyst time previously spent producing one-off reports.
Financial metrics translate those operational improvements into economic value. Relevant outcomes might include lower reporting costs, reduced overtime, avoided hiring, lower inventory carrying costs, reduced downtime, protected revenue, or improved customer retention. However, organizations should avoid treating every hour saved as an immediate cash saving. Released capacity only becomes financial value when it leads to a tangible outcome, such as avoiding additional headcount, handling more work, or reallocating employees to higher-value activities.
A simplified ROI calculation can be expressed as: ROI = (Total measurable benefit − Total implementation cost) / Total implementation cost × 100
Implementation cost should include more than Power BI licensing. Depending on the use case, organizations may also incur costs for Fabric capacity, semantic-model redesign, data engineering, machine-learning development, external AI services, testing, training, governance, monitoring, and ongoing support.
Decision-quality metrics become particularly important for forecasting, anomaly detection, and predictive modelling. A model that generates more predictions is not necessarily delivering more value. Organizations should evaluate whether those predictions are accurate enough to improve decisions. Depending on the use case, this may involve forecast error, precision and recall, false-positive rates, the percentage of high-risk cases correctly prioritized, or the number of incidents detected earlier than before.
For example, an anomaly-detection system that generates hundreds of alerts may actually increase workload if most alerts are irrelevant. In that case, the useful measures are not the number of anomalies detected, but how many resulted in meaningful investigations, how much detection time improved, and whether important incidents were missed.
Connect AI Metrics to Business Outcomes
The strongest ROI cases connect the AI capability directly to a business action. A demand forecast has limited value if nobody changes inventory or staffing decisions because of it. Similarly, a churn-risk model creates value only when teams use those scores to prioritize retention activity and that intervention improves customer outcomes.
The relationship can be summarized as: AI capability → analytical improvement → operational action → measurable business result
For example, Power BI anomaly detection may shorten the time needed to identify an operational exception. Faster detection then enables an operations team to intervene earlier, potentially reducing downtime or service disruption. Likewise, Copilot may reduce the time executives spend locating information, but its measurable value depends on whether that faster access improves reporting cycles or decision turnaround.
A useful measurement framework is:
| AI use case | What to measure | Potential business outcome |
|---|---|---|
| Copilot-assisted reporting | Time spent answering recurring questions | Lower analytical workload |
| Natural-language analysis | Time from question to insight | Faster decision-making |
| Anomaly detection | Detection and investigation time | Reduced operational impact |
| Demand forecasting | Forecast accuracy | Lower inventory imbalance |
| Churn prediction | Accuracy of customer prioritization | Revenue retention |
| Predictive maintenance | Detection of high-risk assets | Reduced downtime |
| Sentiment analysis | Time to identify recurring issues | Faster customer response |
Measurement Pitfalls to Avoid
One of the most common mistakes is measuring adoption instead of value. High Copilot usage or increased report interactions may indicate that employees find a feature interesting or convenient, but they do not prove that business performance has improved. Adoption is useful as an intermediate metric, but it should ultimately be linked to changes in productivity, decision speed, accuracy, or financial outcomes.
Another common problem is attributing a broader transformation entirely to AI. Power BI projects often involve several improvements at the same time, including cleaner data pipelines, better semantic models, automated refresh processes, standardized KPIs, and redesigned reports. If reporting time falls substantially after implementation, AI may have contributed, but it may not be the only reason. Business cases should acknowledge these factors rather than assigning the entire improvement to one AI feature.
Percentage-based claims also require context. Saying that AI “improved productivity by 30%” is difficult to evaluate without knowing what productivity means, how it was measured, what the starting point was, and over what period the improvement occurred. A statement such as “monthly report preparation decreased from ten hours to six hours across six reporting cycles” provides substantially stronger evidence.
Organizations should also include negative effects in the calculation. AI may introduce new costs through false-positive investigations, correction of generated answers, additional capacity consumption, model monitoring, security review, or user training. A credible ROI model considers this additional effort rather than measuring benefits alone.
Evidence-Led Examples and Case Studies
External case studies can provide useful evidence of what Power BI and AI can achieve, but they should be interpreted carefully. The strongest examples clearly identify the original business problem, the capability implemented, the process that changed, and the measurable result.
It is also important to distinguish between different levels of evidence. A reported customer result is not the same as a projected benefit, and neither should be presented as a universal benchmark. For example, a documented customer case may show that monthly reporting decreased from five days to three in one organization. Another company may estimate that a similar implementation could save 1,000 analyst hours annually. The first is an observed result; the second is a forecast based on assumptions.
Vendor-published case studies can therefore demonstrate what is possible, but they should not be treated as guarantees. Results depend heavily on data maturity, implementation scope, user adoption, process design, and existing technology infrastructure.
Where reliable external evidence is unavailable, an internal pilot often provides stronger decision-making evidence than a broad industry statistic. Testing the capability against the organization’s own data, employees, workflows, and baseline performance makes it easier to determine whether the investment is likely to deliver meaningful value.
A Practical ROI Framework
Organizations can ultimately assess Power BI AI initiatives across four questions: Did the capability reduce effort? Did it improve analytical or decision quality? Did that improvement create an observable business outcome? And was the value greater than the total cost of implementation and operation? ROI should also be reviewed after deployment rather than calculated only once during project approval. Data volumes, model accuracy, user behavior, licensing costs, and business conditions can all change over time.
A use case that delivered strong value during the first year may require optimization or may no longer justify its operating cost later. The strongest ROI case for AI in Power BI is therefore not that an organization has adopted more AI functionality. It is that a specific capability improves a defined workflow or decision, produces a measurable outcome, and continues to deliver enough value to justify its cost.
9. Power BI AI Platform Direction
Power BI’s AI direction is increasingly centered on making governed business data easier to explore through natural language, while preserving the analytical tools that users already rely on for explanation, forecasting, and advanced modelling. Copilot is becoming the primary interface for this shift.
At the same time, Microsoft continues to support AI-powered visuals and integrations with machine-learning environments for use cases that require more structured analysis or specialized models. The result is not a single AI capability replacing everything else, but a broader architecture in which conversational AI, semantic models, visual analytics, and external AI services work together.
Copilot, Semantic-Model Readiness, and Governed AI Experiences
The most significant change in Power BI is the growing importance of Copilot as an interface between users and governed organizational data. Rather than requiring users to know which report page, visual, or measure contains an answer, Copilot allows them to ask questions in natural language, summarize reports, explore semantic-model data, and assist with report-authoring tasks. This direction is also reflected in Microsoft’s decision to retire Power BI Q&A experiences in December 2026 and recommend Copilot as the more integrated natural-language alternative.
This transition makes semantic-model quality increasingly important. A conventional dashboard limits users to predetermined analytical paths. Conversational AI allows them to ask questions that report designers may not have explicitly anticipated. As a result, unclear measures, duplicated concepts, ambiguous field names, or conflicting business definitions can become visible very quickly.
Microsoft has responded by introducing dedicated semantic-model preparation capabilities for AI. For example, AI data schemas allow model authors to define a focused subset of fields that Copilot should prioritize when answering data questions. Microsoft notes that reducing unnecessary schema complexity can help Copilot produce clearer and more accurate responses.
Together with verified answers and AI instructions, these capabilities point toward a model in which organizations do not simply enable generative AI on top of existing reports. They deliberately prepare a governed semantic layer that tells the AI which data matters, what key business concepts mean, and how important questions should be interpreted.
This changes the role of the semantic model. It is no longer only the technical layer connecting data to reports; it increasingly becomes the business context through which AI interprets organizational information. For enterprises, this means future Power BI investments should place greater emphasis on semantic-model governance, shared KPI definitions, metadata quality, access control, and ownership. Organizations with fragmented datasets and conflicting definitions may find that generative AI exposes those inconsistencies rather than solving them.
The Continuing Role of AI Visuals and Machine-Learning Integrations
The expansion of Copilot does not make Power BI’s existing AI capabilities obsolete. AI-powered visuals continue to provide structured ways to investigate specific analytical questions. Microsoft continues to position Key Influencers, Decomposition Tree, Smart Narrative, and Anomaly Detection as AI-powered Power BI visuals. Key Influencers helps identify factors associated with an outcome, the Decomposition Tree supports multidimensional exploration, Smart Narrative generates textual explanations, and Anomaly Detection highlights unexpected changes in time-series data.
These capabilities remain useful because conversational AI and analytical visuals address different needs. Copilot is well suited to broad exploration, summarization, and natural-language interaction, while AI visuals provide a more controlled way to examine a defined metric or analytical relationship. For example, a manager may initially use Copilot to ask why operational costs increased. The investigation could then move to a Decomposition Tree to examine the increase systematically by business unit, location, supplier, and expense category. The two approaches complement each other rather than compete.
Machine-learning integrations also remain important for use cases that exceed the scope of native Power BI analytics. Churn prediction, credit-risk modelling, predictive maintenance, complex demand forecasting, and specialized NLP applications may require models developed in Microsoft Fabric, Azure Machine Learning, Python, R, or another external platform.
In these architectures, Power BI typically acts as the decision-support layer. Model development, training, versioning, and inference may take place elsewhere, while Power BI combines the resulting predictions with operational and financial context. This separation is likely to remain important because reporting platforms and machine-learning platforms solve different parts of the problem. Power BI helps users understand and act on predictions; dedicated AI environments provide the controls required to build and manage the models themselves.
How to Evaluate New Capabilities Without Overcommitting
Power BI and Microsoft Fabric are evolving quickly, particularly around generative AI. Organizations should therefore avoid designing long-term analytics strategies around individual preview features or assuming that every newly introduced AI capability should immediately be deployed across the enterprise. A better approach is to evaluate new functionality against a consistent set of questions: Does it solve an existing business problem? Does it improve on the current process? Is the underlying data ready? Can the output be governed and validated? And does the expected value justify the additional cost and complexity?
Feature maturity also matters. A capability that works well for exploratory analysis may not yet be appropriate for a regulatory, financial, or customer-facing workflow. Teams should review availability, licensing requirements, regional support, documented limitations, security behaviour, and Microsoft’s product lifecycle before making it a dependency for a critical process.
New capabilities should therefore enter through focused pilots rather than broad platform mandates. A pilot can test the feature against representative business questions, known answers, security roles, realistic data volumes, and defined success metrics. If the capability demonstrates consistent value, it can then be incorporated into the wider Power BI operating model.
Organizations should also avoid tightly coupling business processes to a particular user-interface feature where possible. The planned retirement of Power BI Q&A illustrates why this matters. Q&A remains available today, but Microsoft has already announced that it will be discontinued in December 2026 in favor of Copilot. A more resilient strategy is to invest in the underlying assets that remain valuable even as individual AI interfaces change: high-quality data, governed semantic models, reusable measures, documented business definitions, secure access controls, and reliable data pipelines.
The broader direction of Power BI AI is therefore less about replacing traditional BI with generative AI and more about making trusted analytical data accessible through multiple intelligent experiences. Copilot may increasingly become the conversational layer, but AI visuals, predictive models, and conventional BI will continue to play complementary roles depending on the business question being addressed.
FAQ: AI in Power BI
Does Power BI have built-in AI capabilities?
Yes. Power BI includes several built-in AI-assisted capabilities for exploring, explaining, and presenting data. These include AI visuals such as Key Influencers and Decomposition Tree, anomaly detection, Smart Narrative, forecasting, and Copilot experiences for natural-language analysis and report creation.
Power BI can also work with AI capabilities outside the reporting layer, including Microsoft Fabric, Azure Machine Learning, Python, R, and other external models. The appropriate option depends on whether the requirement is exploratory analysis, conversational reporting, data enrichment, or more advanced predictive modelling.
What is the difference between Copilot, AI visuals, and machine-learning integrations?
Copilot is primarily a generative and conversational AI experience. It helps users ask questions about governed data, summarize reports, explore semantic models, and support report-authoring tasks.
AI visuals are more focused analytical tools. Key Influencers helps identify factors associated with an outcome, Decomposition Tree supports structured exploration of KPI contributors, and Anomaly Detection highlights unexpected changes in time-series data.
Machine-learning integrations are appropriate when organizations need more advanced prediction, classification, scoring, or custom modelling. These models may be developed in Microsoft Fabric, Azure Machine Learning, Python, R, or another platform, with Power BI used to present the resulting predictions alongside business data.
What data and model preparation are needed before using AI in Power BI?
AI performs best when the underlying data is accurate, timely, consistent, and clearly structured. Organizations should validate source data, relationships, refresh processes, KPI definitions, and access controls before introducing AI-assisted analytics. For Copilot in particular, semantic-model quality is important. Measures should have clear business definitions, technical fields should be hidden where appropriate, and terminology should be consistent. AI data schemas, verified answers, and AI instructions can also help guide how Copilot interprets the model and responds to business questions.
Can Power BI use external AI or machine-learning models?
Yes. Power BI can consume predictions and classifications produced by external AI and machine-learning environments. These may include Microsoft Fabric, Azure Machine Learning, Python or R workflows, Databricks, internal APIs, or other enterprise AI platforms.
In many production scenarios, the most reliable architecture is to perform model training and inference upstream, store the resulting scores or predictions in a governed data platform, and then expose them through Power BI. This separates model lifecycle management from business reporting and generally improves scalability, monitoring, and auditability.
How should organisations validate AI-generated insights?
AI-generated outputs should be validated according to the level of business risk involved. For exploratory reporting, this may involve checking measures, filters, dates, and source values before sharing conclusions. Predictive use cases require additional testing such as forecast error, precision, recall, false-positive rates, and performance across different business segments.
Organizations should also compare AI outputs with approved reports or known answers, test access controls, monitor changes over time, and document significant limitations. High-impact decisions should retain human review rather than relying on AI-generated recommendations automatically.
Conclusion
AI is expanding what Power BI can do, but its greatest value does not come from adding AI to every dashboard. It comes from applying the right capability to a clearly defined analytical or business decision.
Built-in AI visuals can accelerate investigation and explanation, while Copilot makes governed data easier to explore through natural language. More advanced forecasting, classification, and predictive use cases can extend Power BI through Microsoft Fabric, Azure Machine Learning, Python, R, and other external AI platforms. Across all of these approaches, the same foundations remain critical. Reliable source data, well-designed semantic models, clear KPI definitions, appropriate security controls, and human validation determine whether AI-generated insights can actually be trusted and used.
Organizations should therefore approach AI in Power BI incrementally: start with a measurable business problem, select the simplest capability that can address it, validate the results through a focused pilot, and scale only when the solution demonstrates clear operational or financial value. As Power BI continues to evolve toward more conversational and AI-assisted analytics, organizations that invest in these underlying data and governance foundations will be better positioned to adopt new capabilities without sacrificing reliability, security, or decision quality.
Next Steps
Power BI can provide the analytical interface for AI-driven decision-making, but more advanced use cases often require capabilities beyond the reporting layer. If your organization is exploring predictive analytics, AI-powered data processing, intelligent workflows, or custom machine-learning solutions, SmartDev can help design and implement the underlying AI architecture while integrating insights into the tools your teams already use. Explore SmartDev’s AI Engineering services to see how we help organizations move from AI experimentation to secure, scalable business applications.
References
- https://techcommunity.microsoft.com/blog/educatordeveloperblog/power-bi-ai-features-for-all-data-analysts/3835447
- https://powerbi.pl/en/blog/microsoft-power-bi-en/power-bi-and-artificial-intelligence-how-ai-is-revolutionizing-data-analytics
- https://www.onlc.com/blog/power-bi-ai-features/
- https://learn.microsoft.com/en-us/power-bi/create-reports/sample-artificial-intelligence
- https://www.sqlbi.com/articles/ai-in-power-bi-time-to-pay-attention/