TL; DR
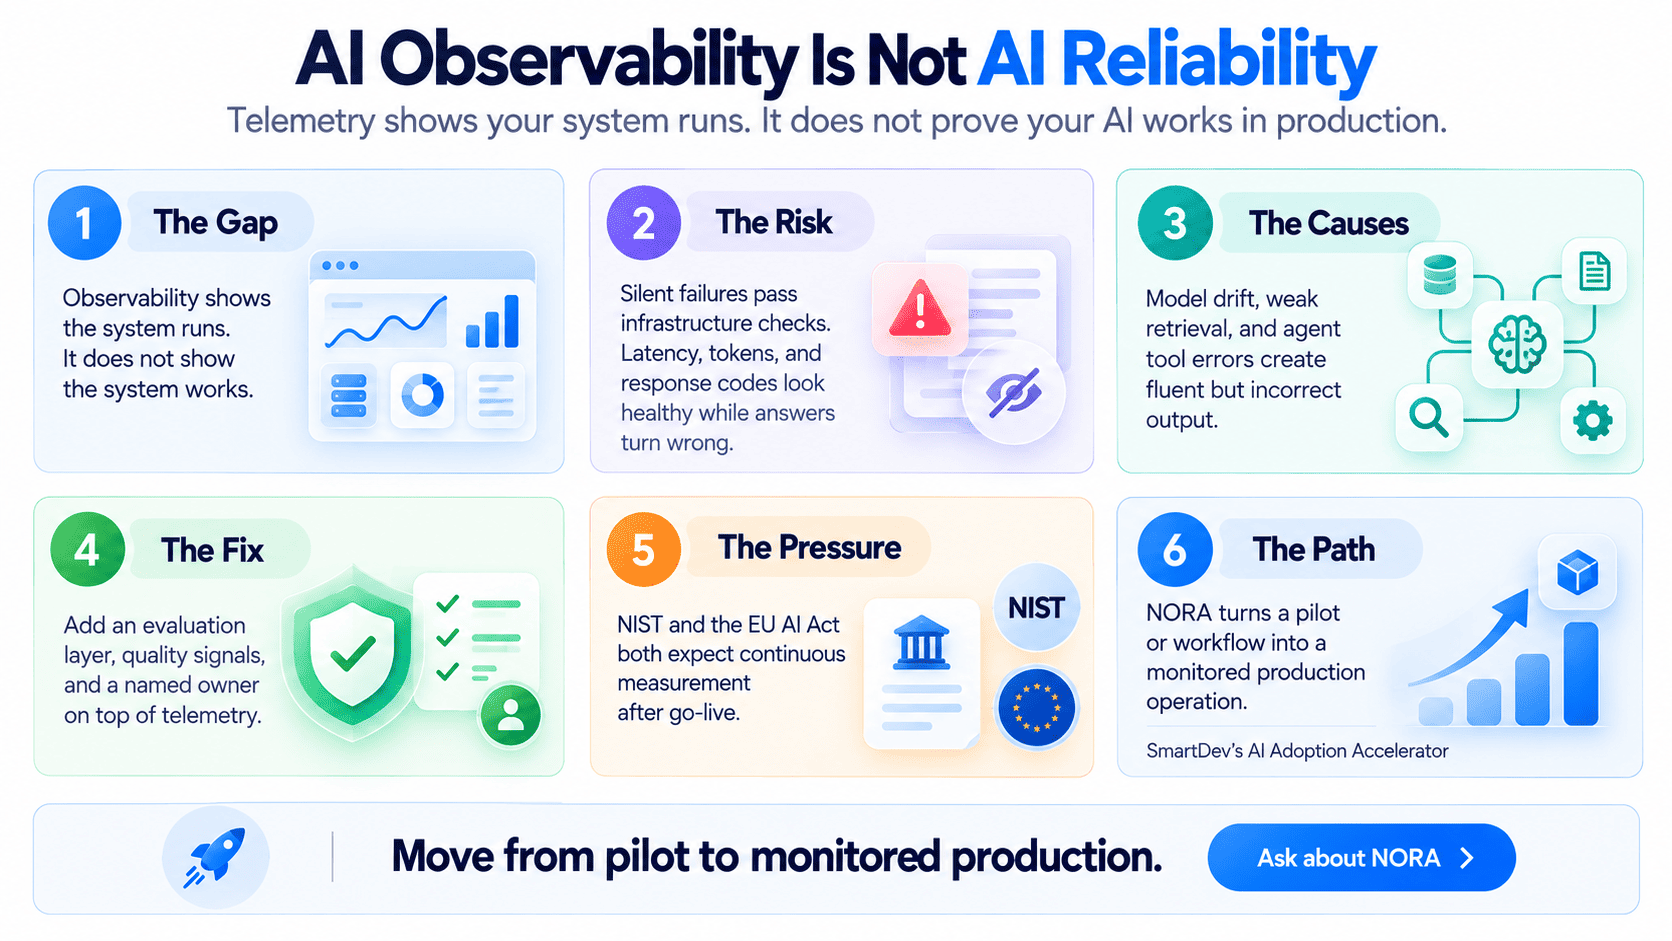
- The gap: AI observability shows that your system runs. It does not show that your system works.
- The risk: Silent failures pass every infrastructure check. Response codes, latency, and token counts stay healthy while answers turn wrong.
- The causes: Model drift, weak retrieval, and agent tool errors all produce fluent but incorrect output.
- The fix: Add an evaluation layer, quality signals, and a named owner on top of your telemetry.
- The pressure: NIST and the EU AI Act both expect continuous measurement after go-live.
- The path: SmartDev’s NORA turns a pilot or workflow into a monitored production operation. Contact us to start.
Introduction
The green dashboard problem
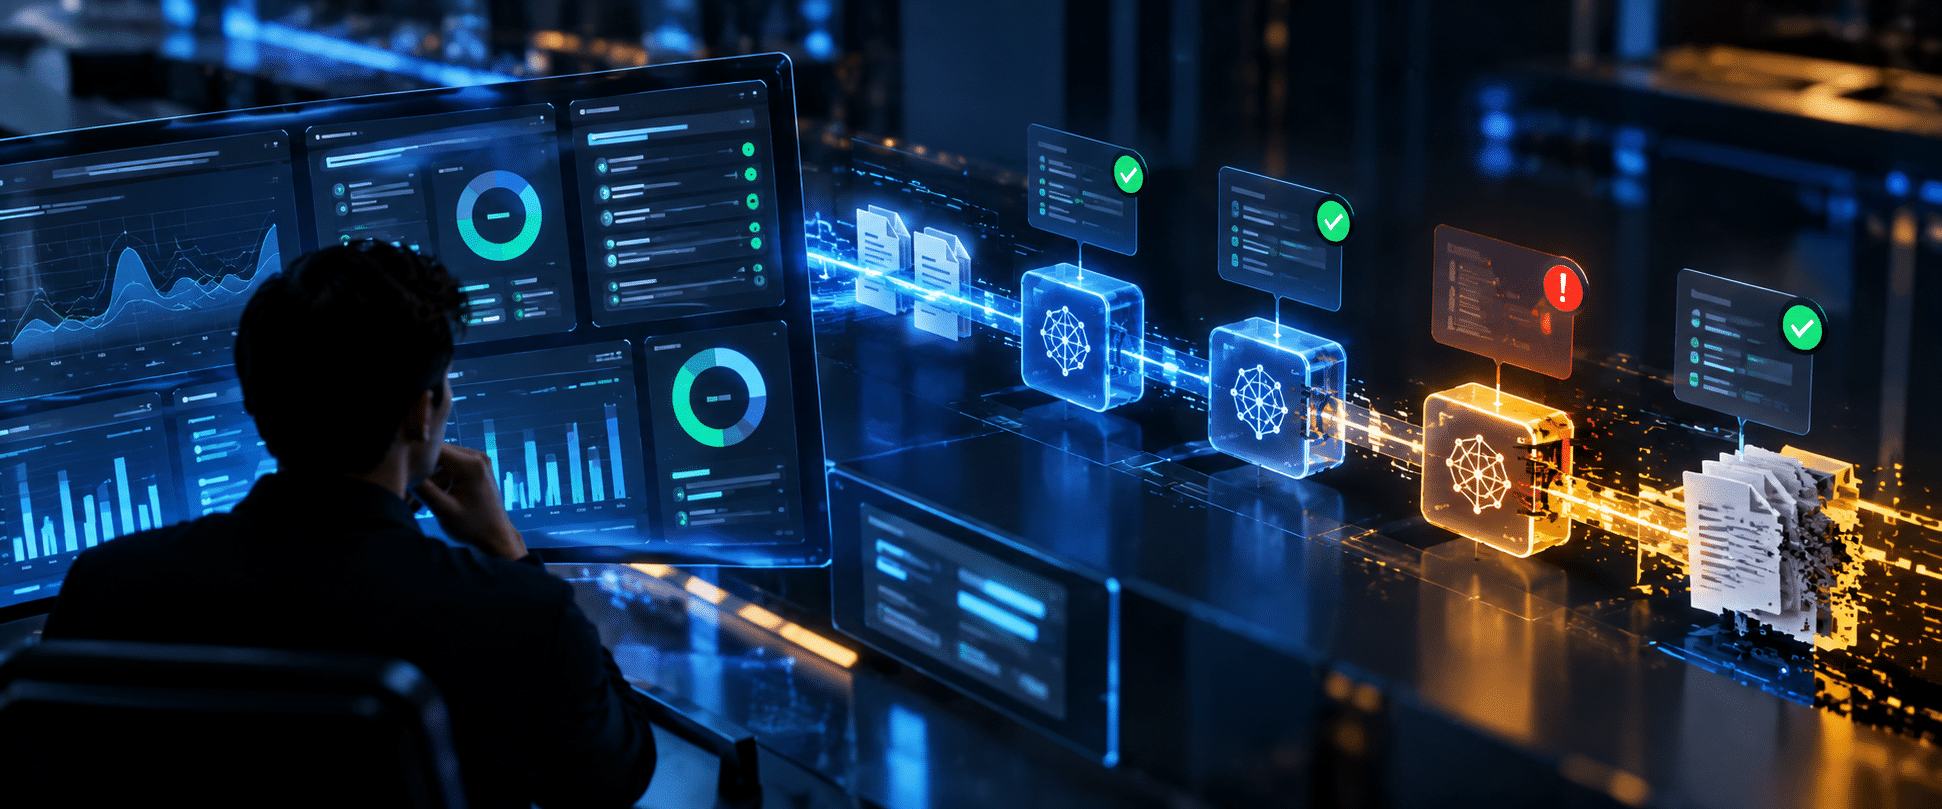
Your dashboard shows green. Latency sits inside target; error rates stay flat, and token spend follows its usual curve. Meanwhile, your AI assistant may quote the wrong policy clause to a customer. No alert fires, because nothing technically broke.
This gap explains why observability alone cannot protect an AI workflow. Observability tells you the system runs and shows where time and tokens go. However, it cannot tell you whether an answer was correct, grounded, or safe to act on. As a result, teams often learn about failures from customers, auditors, or regulators instead of their own tooling.
Why the stakes keep rising
The evidence points to a production problem, not a model problem. SmartDev’s homepage cites MIT NANDA research showing that 95% of generative AI pilots deliver no measurable P&L impact. Similarly, Gartner predicts that over 40% of agentic AI projects will be canceled by the end of 2027. Gartner names escalating costs, unclear business value, and inadequate risk controls as the reasons.
Moreover, our earlier posts on moving from AI pilot to controlled production and build versus buy AI decisions show the same pattern. Teams ship the model, then lose sight of whether it still does the job.
What this article covers
First, we define what AI observability covers and where it stops. Next, we explain why healthy dashboards hide real failures, and which signals they miss. Then we show how to build an evaluation layer, meet governance expectations, and use NORA to keep a workflow accountable after launch. Finally, we answer common questions and close with the next steps. You can also browse the SmartDev AI Adoption & ITO Glossary for any unfamiliar term.
What AI Observability Covers, and Where It Stops
Observability answers “what happened”
Observability collects traces, metrics, and logs, so engineers can reconstruct system behavior after the fact. Google’s SRE book chapter on monitoring frames the goal as two questions: what is broken, and why? AI observability extends that habit to model calls, retrieval steps, and tool use.
This approach works well for debugging. For example, a trace can show that a slow request waited on a vector database, or that an integration returned an error. Consequently, engineers fix infrastructure faults faster. The approach still assumes that a failure announces itself through a fault signal, and AI failures often do not.
The four golden signals still matter
The SRE book names four golden signals: latency, traffic, errors, and saturation. It advises teams to measure all four and page a human when one looks problematic. The book also warns that a slow error is worse than a fast error, so teams should track error latency instead of filtering errors.
These signals detect user pain before anyone knows the cause. Nevertheless, they measure the container, not the content. An LLM call can return quickly and successfully while it states something false. Therefore, golden signals form a necessary foundation but are not sufficient for AI systems.
GenAI telemetry now has a shared vocabulary
The OpenTelemetry project publishes semantic conventions for generative AI spans. The specification names each model-call span from the operation and the requested model. A companion metric, gen_ai.client.token.usage, records token consumption. Teams gain portable data that works across backends and vendors.
However, the conventions still carry “Development” status, so attribute names may change. More importantly, they describe calls, not correctness. A span can record the model, the tokens, and the duration. It cannot record whether the answer matched your policy. You need a separate mechanism for that judgment.
Traces show the path, not the verdict
A trace shows which documents the retriever fetched, and which tool the agent called. That evidence helps you investigate a bad answer after you know it was bad. In contrast, a trace rarely tells you that the answer was bad in the first place.
Think of a flight recorder. It explains a crash in detail, yet it does not steer the plane. Likewise, traces explain failures after someone notices them. To notice failures earlier, you need signals that judge output quality, which later sections describe.
The visibility hierarchy
The figure below arranges the layers of AI visibility from infrastructure to business outcome. Observability tooling covers the lower two layers well. The upper two layers need evaluation and ownership.
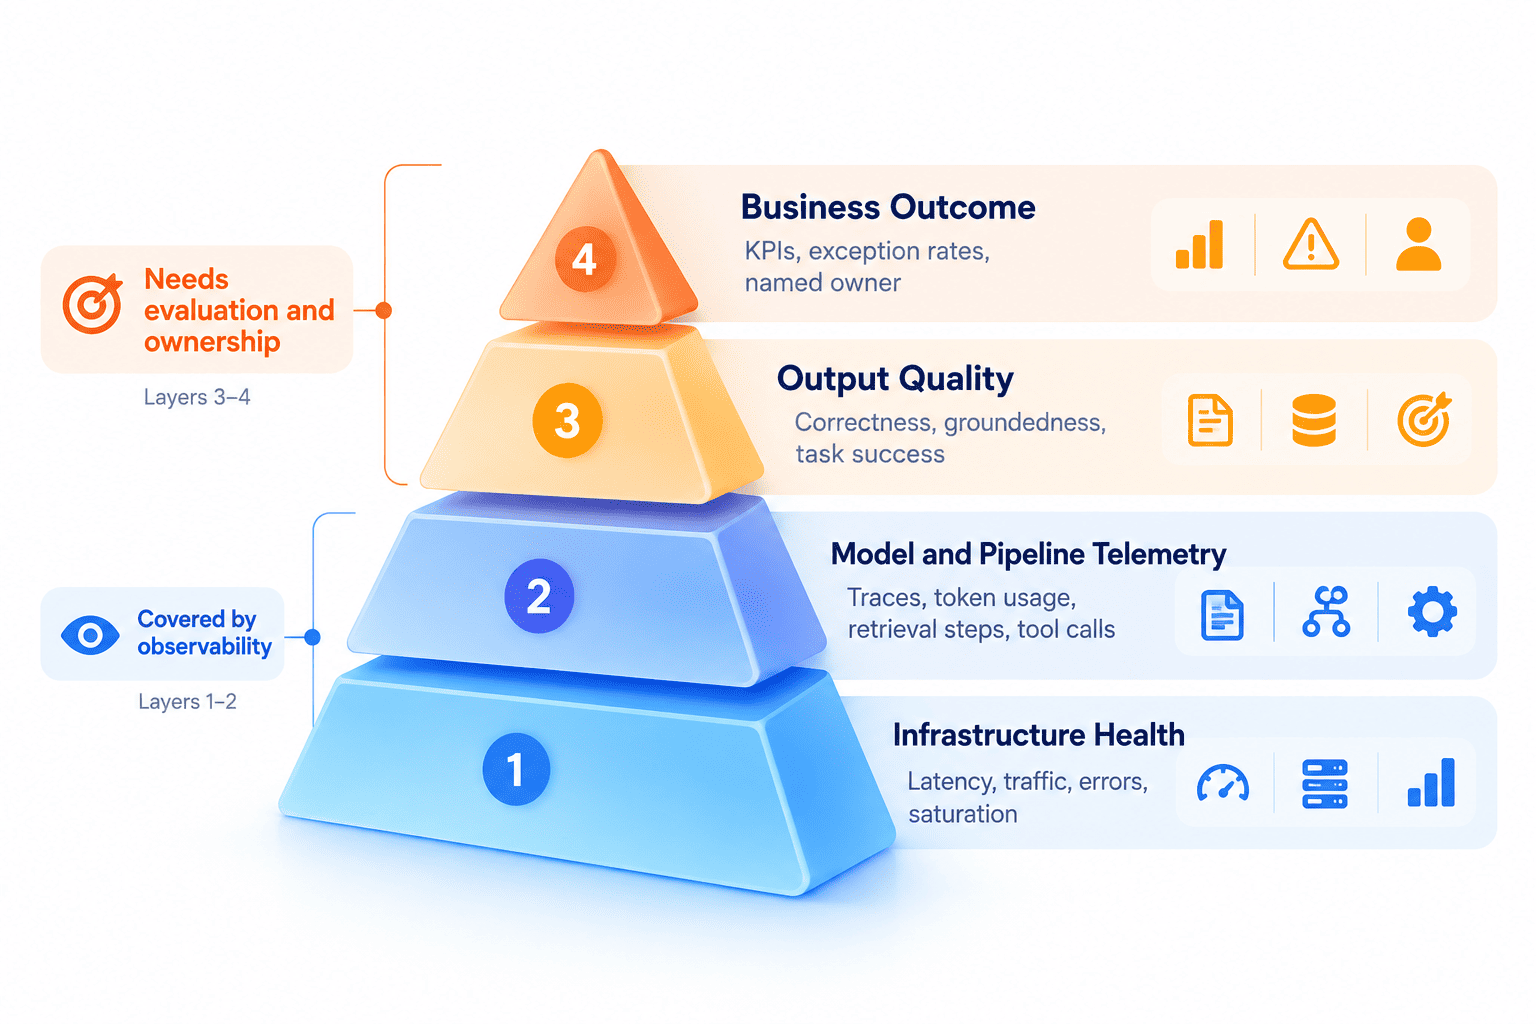
Each layer answers a different question, and each needs different tools. The walkthrough below starts at the base and moves up. Pay attention to where observability tooling ends and where evaluation and ownership begin.
Layer 1: Infrastructure health
Layer 1 asks whether the service is alive and responsive. It relies on the four golden signals from the SRE book: latency, traffic, errors, and saturation. Every engineering team already tracks these signals, and they catch outages fast. However, they say nothing about what the model actually wrote.
Layer 2: Model and pipeline telemetry
Layer 2 opens the box between request and response. It records which model ran, how many tokens it used, which documents the retriever fetched, and which tools the agent invoked. OpenTelemetry’s GenAI conventions give this data a shared format. Engineers use it to trace a slow or failing request to its cause. Still, the data describes activity, not accuracy.
Layer 3: Output quality
Layer 3 judges each answer. It asks whether the output is correct, whether it follows its retrieved sources, and whether the task is finished. Observability tools do not produce these verdicts on their own. You need golden datasets, automated judges, and sampled human review, which the evaluation section describes below.
This layer also catches drifts. When a model update changes behavior, layer 3 scores fall while layers 1 and 2 stay flat. Consequently, layer 3 gives you the earliest warning of a silent failure.
Layer 4: Business outcome and ownership
Layer 4 connects the workflow to the business. It tracks KPIs such as cases resolved, exception rates, human overrides, and cost per successful outcome. Crucially, it also names a person who owns those numbers. Without an owner, a falling KPI triggers a debate instead of a fix.
Layers 3 and 4 depend on each other. Quality scores mean little without a business target, and a business target means little without quality scores. Therefore, build both together and give them the same alert path as your infrastructure.
How the layers work together
Use one working rule: a problem should surface at the lowest layer that can detect it. Outages surface at layer 1. Slow retrieval surfaces at layer 2. Wrong answers surface at layer 3. Missed business goals surface at layer 4. If a failure only appears at layer 4, your lower layers have a blind spot to close.
Takeaway: Observability explains how your AI system behaves. It does not judge whether the behavior is right. Treat it as the base layer, then add evaluation and ownership above it.
Why Healthy Dashboards Hide Real Failures
A successful response can carry a wrong answer
Traditional software fails loudly. A broken function throws an exception, and a dead service returns a 500 error. AI systems fail differently. A language model always produces text, so the request completes; the status code reads 200, and the latency looks normal.
Consequently, every infrastructure check passes while the content fails. A support bot may cite a discontinued refund policy. A document workflow may extract the wrong invoice total. Because the output looks fluent, no threshold trips, and no engineers get paged.
Model drift changes behavior without a deploy
Your code can stay identical while your results change. Researchers at Stanford and UC Berkeley compared the March and June 2023 versions of GPT-3.5 and GPT-4. They found that GPT-4 identified prime versus composite numbers with 84% accuracy in March and only 51% in June.
The authors conclude that the behavior of the “same” LLM service can change substantially in a short time, and they call for continuous monitoring. In practice, a vendor update can shift your outputs even though your release log shows nothing. Drifts like this never appear in latency charts.
Retrieval and tool failures stay quiet
Many enterprise AI systems retrieve documents before they answer. If the retriever returns stale or irrelevant passages, the model still writes a confident reply. Similarly, if an agent calls the wrong tool or misreads a tool result, the workflow continues as if nothing happened.
Each step succeeds technically, so each span shows green. Yet the chain of steps produces a wrong outcome. For this reason, you must evaluate the result, not only for each hop. Our post on AI agent access and identity explains why agents that act autonomously raise the stakes further.
Agents multiply the failure paths
An agent plans, calls tools, reads results, and plans again. Every loop adds a chance for a subtle error to compound. A small misreading in step two can shape every later decision, and the final answer hides where the mistake began.
This complexity helps explain why Gartner links agentic project cancellations to inadequate risk controls and unclear value. Teams that cannot show whether an agent works also cannot defend its cost. Therefore, agent reliability depends on measuring outcomes, not just activity. The SmartDev podcast episode on pairing AI with human expertise in fraud prevention shows how one compliance team balances the two.
Anatomy of a silent failure
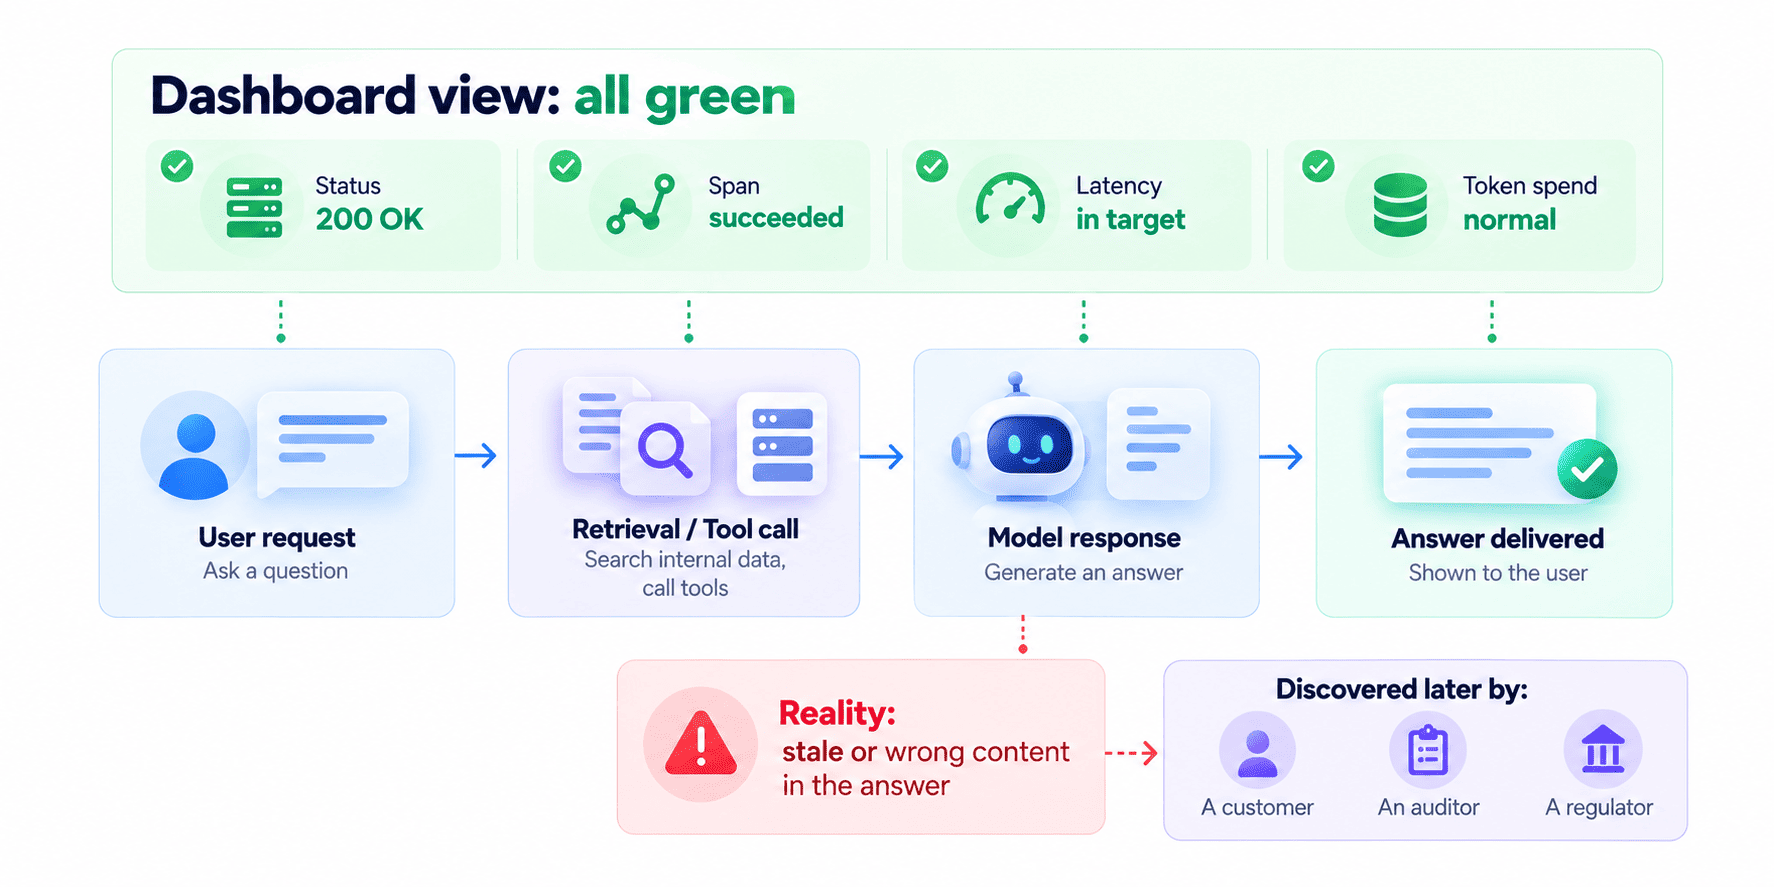
The next figure follows a single request through a typical retrieval-based workflow. Every technical check pass, yet the customer receives the wrong answer. Someone outside your team usually finds the problem.
How to use this dashboard the right way
Treat a green dashboard as a gate, not a verdict. Green means the plumbing works: requests arrive; models respond and spend looks normal. It does not mean the answers are right. Read every green light as “safe to investigate quality,” never as “safe to relax.”
Follow a simple routine each time you open it. First, check layers 1 and 2 to rule out infrastructure faults. Next, open the quality view, which shows canary scores, groundedness, exception rate, and override rate. Then compare both views across the same time window. If infrastructure stays green while quality drops, suspect drift, stale retrieval, or a tool error.
Finally, put a quality tile beside every technical tile. Pair status with correctness, latency with task completion, and token spend with cost per successful outcome. Assign an owner to each tile and set a threshold that triggers a page. In addition, review the dashboard weekly with your domain experts, because they can spot a wrong answer that no metric flags.
Takeaway: AI failures rarely raise faults. Drift, weak retrieval, and agent errors all produce fluent wrong answers. Judge the outcome of each request, not only the health of each component.
The Signals Observability Misses
Output correctness
Correctness asks a simple question: did the system give the right answer? For a document workflow, that means the extracted field matches the source. For a compliance workflow, it means the decision follows the approved rule. You measure it by comparing outputs against known-good references.
Correctness needs ground truth, which takes effort to build. Nevertheless, it forms the most direct signal of value. Without it, you rely on proxies such as latency, and proxies cannot distinguish the right answer from the wrong one.
Groundedness and source fidelity
Groundedness checks whether the answer stays faithful to the sources the system retrieved. A grounded answer cites material that supports its claim. An ungrounded answer invents detail or stretches a source beyond what it says.
This signal matters most in regulated settings, where every decision need evidence. Therefore, log the retrieved passages next to each answer. Then score whether the answer follows them. Our NORA Compliance page describes this need as decisions that stay evidenced and defensible against approved rules.
Task completion and outcome success
A workflow succeeds when the business task finishes correctly, not when the model responds. An invoice must reach the ledger with the right amount. A KYC file must reach a decision with complete evidence. Measure completion at that business level.
Outcome metrics also expose problems that component metrics hide. For instance, a system may answer every question quickly yet resolve a few cases from end to end. Only a task-level metric reveals that gap. Consequently, define success per workflow before you build dashboards.
Exception and human-override rates
Every production AI workflow needs a path for cases the system cannot handle. The rate at which cases reach that path tells you a great deal. A rising exception rate can signal drift or new edge cases. A falling rate can signal healthy improvement, or it can signal that the system now hides uncertainty.
Likewise, track how often human reviewers override or correct the system. Each override marks a disagreement between the model and an expert. Review these cases regularly, because they show exactly where the workflow needs tuning.
Cost per successful outcome
Tokens spent alone can be misled. A cheap request that fails costs more than an expensive request that succeeds, because someone must redo the work. Therefore, divide total cost by the number of correct, completed outcomes.
This ratio also connects technical metrics to the business case. It answers the question Gartner raises when it cites escalating costs and unclear value. Finally, it gives executives one number they can track over time, instead of a dashboard they cannot interpret.
Golden signals versus quality signals
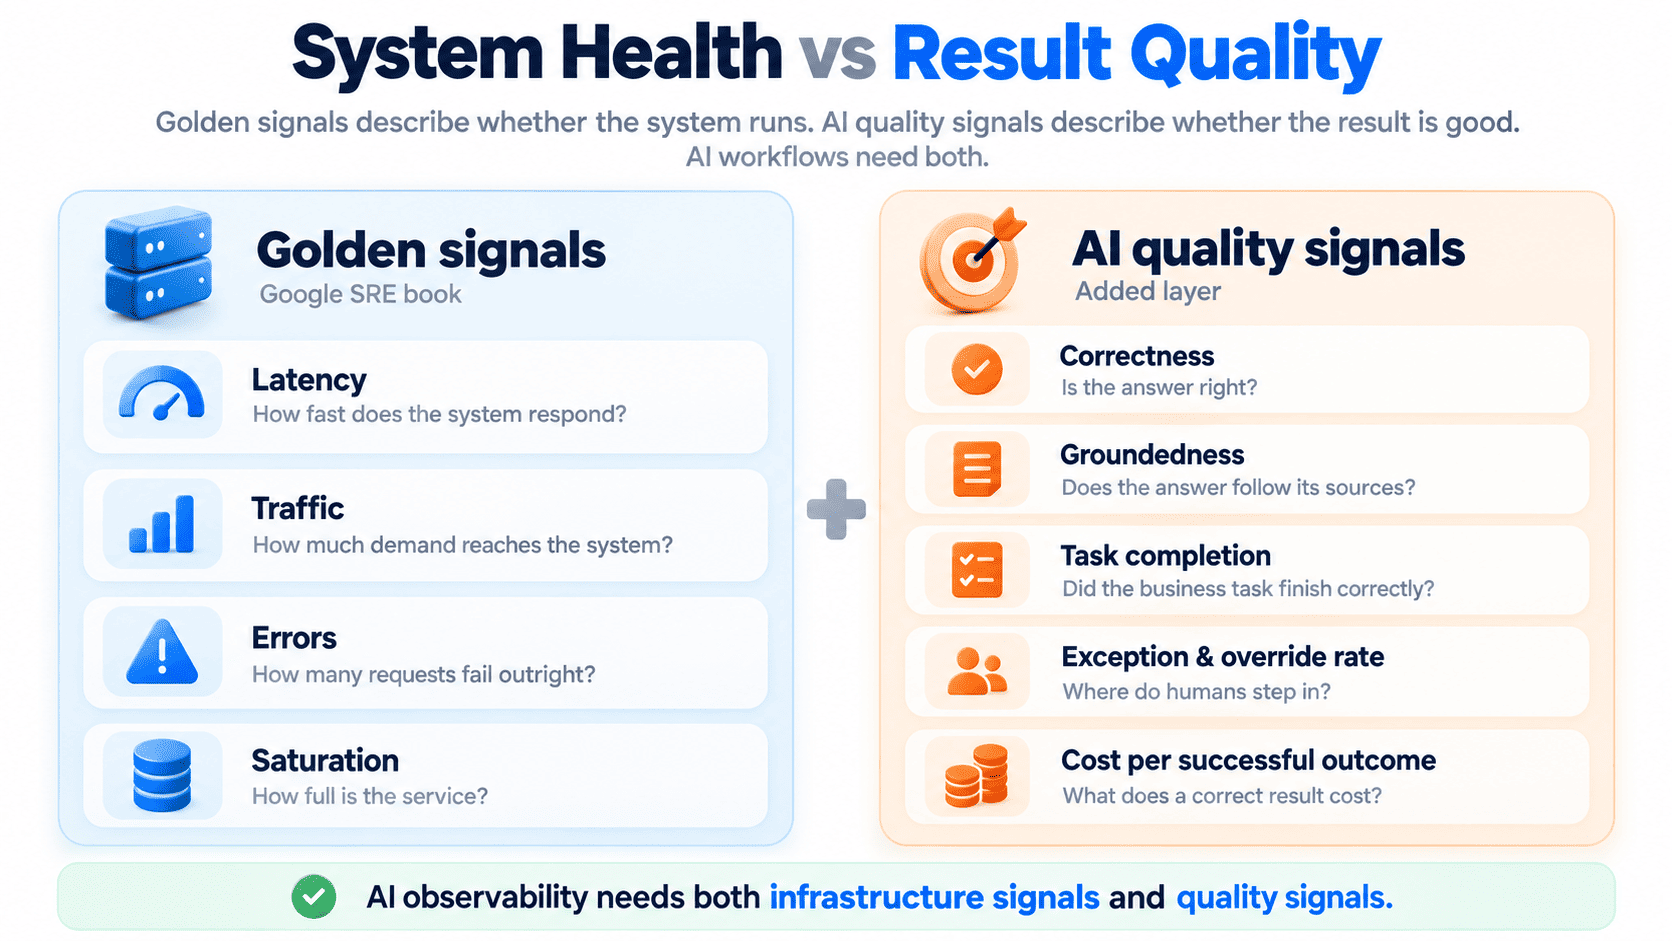
The figure below pairs each golden signal with the AI quality signal that completes it. Read it as a checklist: for every technical signal you track, ask which quality signal sits beside it.
How to Use This Checklist the Right Way
Use the checklist in two layers. First, check the golden signals to understand whether the system is operating normally: Is it responding fast enough? Is traffic within expected levels? Are requests failing? Is the service approaching capacity?
Then check the AI quality signals to determine whether the results themselves are reliable: Is the answer correct? Is it grounded in its sources? Did the business task actually finish? How often do humans need to intervene or override the result? And what does each successful outcome cost?
Do not treat one layer as a substitute for the other. A system can have healthy latency, low errors, and sufficient capacity while still producing incorrect or poorly grounded results. Conversely, accurate outputs may not be sustainable if the system is too slow, overloaded, or expensive. Use both layers together to assess whether an AI workflow is not only running but producing the right outcomes at an acceptable cost.
Takeaway: Five quality signals complete the golden signals: correctness, groundedness, task completion, exception and override rate, and cost per successful outcome. Define them per workflow before you launch.
Building an Evaluation Layer on Top of Telemetry
Start with a golden dataset
A golden dataset holds real inputs paired with verified correct outputs. Build it from actual cases, especially the hard ones, and have domain experts confirm each answer. This set becomes your reference for every future change.
Keep the dataset alive. Add new edge cases as they appear in production and retire cases that no longer reflect reality. Additionally, store the dataset under version control, so you can compare results across model updates. Without this baseline, you cannot tell improvement from drift.
Use LLM-as-a-judge with clear limits
Reviewing every output by hand does not scale. Researchers at UC Berkeley and partner institutions studied LLM-as-a-judge and found that strong LLM judges reach over 80% agreement with human preferences. That rate matches the agreement level among human experts.
The same paper documents position, verbosity, and self-enhancement biases, plus limited reasoning ability. Consequently, treat an automated judge as a fast screen, not a final authority. Randomize answer order, calibrate the judge against your golden dataset, and route disputed cases to people.
Sample human review deliberately
Human review is essential for high-stakes decisions. However, reviewers cannot read everything, so sample with intent. Review a random slice to measure overall quality. Then review all low-confidence cases and all cases the judge flags as risky.
Feed the findings back into the golden dataset, and the judge prompts. This loop turns each review into lasting improvement. In addition, it keeps your experts engaged, which matters because you need their domain knowledge to define what “correct” means.
Run online checks and canaries
Offline tests catch problems before release. Online checks catch problems after release, when real data shifts. Replay a fixed set of canary cases against production on a schedule. If scores drop, you learn about drifts before your customers do.
Schedule these checks independently of your deployments. As drift research shows, behavior can change without any change on your side. A weekly canary run costs little and closes to a large blind spot.
Alert on symptoms, not noise
The SRE book advises that alerts should carry high signal and low noise, and that rules for humans should represent a clear failure. Apply that discipline to quality signals. Page someone when correctness on canary cases falls below an agreed threshold, not when one answer looks odd.
Also route each alert to a named owner with authority to act. An alert nobody owns behaves like a log line. Therefore, write the response playbook before the first alert fires.
Takeaway: An evaluation layer needs five parts: a golden dataset, automated judges with known limits, sampled human review, scheduled canaries, and owned alerts. Together they turn telemetry into a verdict.
Governance and Regulatory Pressure
NIST expects measurement and management, not just deployment
The NIST AI Risk Management Framework organizes AI risk work into four functions: Govern, Map, Measure, and Manage. The Measure function uses quantitative, qualitative, or mixed-method tools to analyze, benchmark, and monitor AI risk. The Manage function allocates resources to the risks you mapped and measured.
In other words, the framework treats monitoring as a continuing duty across the AI lifecycle. NIST also released a Generative AI Profile, NIST-AI-600-1, on July 26, 2024. It helps organizations identify risks that generative AI creates and proposes actions to manage them.
The EU AI Act requires post-market monitoring
Article 72 of the EU AI Act requires providers of high-risk AI systems to establish and document a post-market monitoring system. The system must actively and systematically collect and analyze performance data throughout the system’s lifetime. Providers use it to evaluate continuous compliance with the Act’s requirements.
This language shifts the burden. A launch checklist no longer satisfies the obligation. Instead, providers must show ongoing evidence that the system still performs as documented. Check the current application dates and your own risk classification with legal counsel, because timelines and scope can change.
Audit evidence beats dashboards
An auditor does not ask whether your servers stayed up. An auditor asks whether the process followed the rules you approved. A latency chart cannot answer that question, but a record of inputs, retrieved sources, outputs, and reviewer decisions can.
Therefore, design evidence captures from day one. Store each decision with its supporting material and the rule it applied. SmartDev’s whitepaper on NORA in AI workflow automation for risk and compliance explores this approach in depth. Its companion on AI-powered SOC 2 compliance enablement applies it to a specific framework.
Ownership closes the accountability gap
Tools do not own outcomes; people do. Every AI workflow needs a named owner who accepts responsibility for quality, exceptions, and cost. That owner reviews the quality signals, approves changes, and answers to auditors.
Ownership also separates two kinds of knowledge. Your domain experts know the business rules and the risk appetite. Your engineering partner knows how to build and operate the pipeline. Clear roles prevent the common failure where each side assumes the other watches the outcome. Industries such as payments and fintech and professional services and BPO feel this pressure first because their workflows face regulators and clients directly.
Takeaway: NIST and the EU AI Act both point toward continuous measurement after go-live. Auditors want decision evidence and a named owner, and dashboards alone supply neither.
How NORA Closes the Gap
What NORA is and why it exists
NORA is SmartDev’s AI Adoption Accelerator. According to SmartDev, NORA turns a defined workflow or an existing AI pilot into a production operation, then keeps it running. The premise is simple: the model is rarely the bottleneck. Integration, evaluation, human-exception design, and operational ownership are.
That premise matches this article’s argument. Observability tools give you visibility, but nobody owns the gap between “running” and “working.” NORA assigns that ownership and builds the measurement around it. It works alongside SmartDev’s AI-native software development offering, and the two act as independent entry points rather than a mandatory sequence.
Two ways in: Path A and Path B
NORA starts from wherever you are. Path A fits teams that already have a pilot, such as a proof of concept, an internal agent, or a workflow built on a foundation model. Path B fits teams with a defined, recurring workflow that has a named owner, but no AI attached yet.
Both paths lead to production with agreed controls. Path A begins with a production readiness assessment that finds real gaps in integration, data, security, evaluation, control, and ownership. Path B begins with workflow qualification that confirms the problem is measurable and recurring, then baselines the KPIs before any design starts.
Path A: you already have a pilot
Path A fits teams that hold a proof of concept, an internal agent, a Copilot workflow, or a build on a foundation model. SmartDev’s position is that an existing pilot counts in your favor. The pilot has already resolved most technical uncertainty, so Path A skips a separate proof step and runs five stages.
- Stage 1: Production Readiness Assessment tests the pilot against real gaps in integration, data, security, evaluation, control, and ownership.
- Stage 2: Productionization Design decides what to retain, rebuild, or redesign.
- Stage 3: Production Deployment delivers an integrated, hardened, secure solution that runs live in your environment.
- Stage 4: Operate & Optimize monitors the workflow after launch.
- Stage 5: Scale extends where reuse and ROI support the move.
In this article’s terms, stages 1 and 2 reveal how much layers 3 and 4 the pilot lacks. Stages 4 and 5 then keep those layers running.
Path B: you have a defined workflow and no pilot
Path B fits teams with a specific, recurring workflow, a named owner, and a measurable cost, but no AI is attached yet. The process is defined; the automation is not. Path B runs six stages, including one optional proof step.
- Stage 1: Workflow Qualification confirms the problem is measurable and recurring and baselines the KPIs. It ends with a qualified workflow, a target operating design, and a clear build, redesign, or do-not-build decision.
- Stage 2: Production Design redesigns the operating model around AI, deterministic logic, and the people who stay in the loop.
- Stage 3: The optional Rapid Solution Proof runs only when a technical uncertainty needs testing before you commit to a build. It answers one specific question and never serves as the deliverable.
- Stage 4: Production Deployment goes live in your real environment with agreed controls.
- Stage 5: Operate & Optimize drives measured continuous improvement.
- Stage 6: Scale replicates the workflow to adjacent areas where the economics work. Notice that the KPI baseline from stage 1 gives layer 4 its reference point from the start.
How to choose between the paths
Ask one question: does something already run? If yes, choose Path A and start with the readiness assessment. If not, but a workflow has an owner and a measurable cost, choose Path B and start with qualification. SmartDev also notes that you can join at whichever stage fits you today, instead of completing every stage in order.
The stages that build the measurement in
The figure below maps the stages of both paths as SmartDev describes them. Notice that both paths end in Operate & Optimize and Scale. Measurement does not sit at the end as an afterthought; the baseline KPIs come first, so later monitoring has something to compare against.
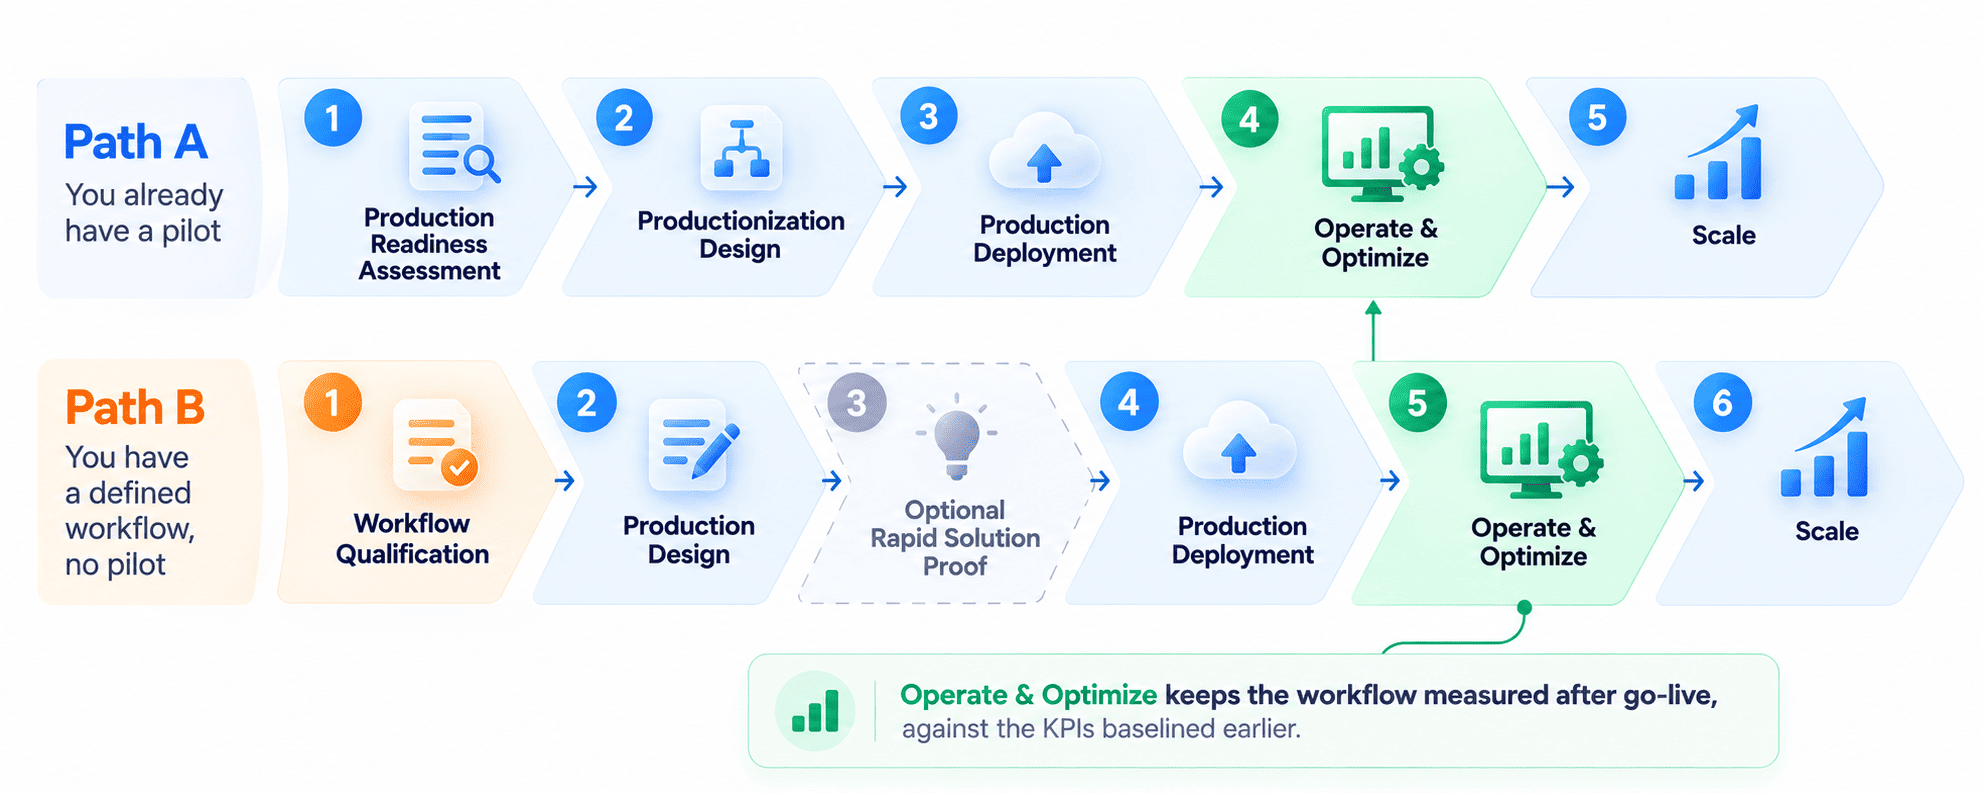
The paths differ at the starting point, but both lead to Operate & Optimize and Scale. Measurement continues after go-live, using the KPIs established earlier.
Operate & Optimize: catching the quiet drift
SmartDev’s NORA page states that an unmaintained AI workflow rarely fails loudly. It drifts quietly. Accuracy degrades real-world data shifts; exceptions pile up unnoticed, and approved controls slowly stop matching what runs. A customer, an auditor, or a regulator then finds the gap first.
NORA Operate & Optimize targets exactly this pattern. It monitors accuracy and exception rates, tunes the workflow monthly as volumes and edge cases evolve, and reviews KPIs against the baseline from qualification. Each item maps the quality signals in this article. Consequently, the workflow keeps earning its value instead of merely staying switched on.
Who owns what, and what the results look like
NORA does not replace your domain experts. According to SmartDev, you own the domain truth: business rules, process meaning, risk appetite, and sign-off. NORA owns turning that truth into a working, evidenced production operation. This split answers the ownership gap from the governance section.
SmartDev’s case studies show the approach in practice. In one insurance KYC project in Singapore, an LLM-powered pipeline parses documents, validates them against compliance rules, and flags risk. SmartDev reports 75% less manual compliance documentation. In a climate-finance governance project, AI-driven policy analysis delivered 60% faster policy analysis and review, according to SmartDev. Browse all SmartDev case studies or read the NORA blog category for more.
Takeaway: NORA adds what observability lacks: production readiness assessment, baselined KPIs, monthly tuning, and clear ownership. It turns a running system into a working one.
Frequently Asked Questions
What is the difference between AI observability and AI evaluation?
AI observability collects traces, metrics, and logs that show how a system behaves. AI evaluation judges whether each output is correct, grounded, and safe. Observability explains what happened. Evaluation decides whether the result was good.
What is a silent failure in an AI system?
A silent failure happens when an AI system returns to a fluent, well-formed answer that is wrong. Every infrastructure check passes, so no alert fires. Teams usually discover the failure through a customer complaint, an audit, or a regulator.
Can LLM-as-a-judge replace human review?
Not fully. Research from UC Berkeley and collaborators found that strong LLM judges reach over 80% agreement with human preferences. The same research documents position, verbosity, and self-enhancement biases. Teams should pair automated judges with sampled human reviews.
How does NORA relate to AI observability?
NORA is SmartDev’s AI Adoption Accelerator. Its Operate & Optimize stage monitors accuracy and exception rates, tunes the workflow monthly, and reviews KPIs against the baseline set during qualification. NORA adds ownership and measurement on top of technical visibility. Read more on the NORA page.
Conclusion
AI observability matters, but it only shows part of the picture. It helps teams monitor latency, traces, and token use and debug technical issues quickly. It answers, “Is the system running?” but not necessarily “Is the system working?” Silent failures can remain hidden in that gap.
To close it, add quality signals, an evaluation layer, and a clear owner. Use golden datasets, calibrated judges, sampled human reviews, and scheduled canaries to measure performance continuously. Keep evidence for each decision as well, so teams can trace how the system performed and why.
Ready to close your own production gap?
Start with one production workflow. Identify the five quality signals you cannot see today, assign an owner, and set one alert on a canary set. From there, you can build a measurement layer around the workflow and expand it as the system scales.
Need help turning an AI pilot or defined workflow into a production-ready system? Contact SmartDev to discuss your workflow, evaluation approach, or next steps.